Here is an example of a simple combination of 2 ListLogPlots using Show with a specified plot range:
Show[
{ListLogPlot[{{2, 10000}}],
  ListLogPlot[{{1, 100}}]},
PlotRange -> {{0, 20}, {100, 100000}}]
here is the resulting plot:
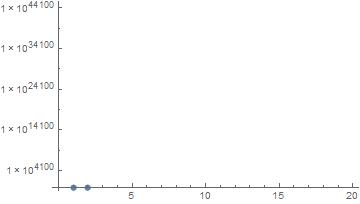
Does anyone know how to resolve this without specifying the plot range for the individual plots like this
Show[{
  ListLogPlot[{{2, 10000}}, PlotRange -> {{0, 20}, {100, 100000}}],
  ListLogPlot[{{1, 100}}, PlotRange -> {{0, 20}, {100, 100000}}]}]
Thanks!


