Message Boards Message Boards

0
|
3563 Views
|
3 Replies
|
1 Total Likes
View groups...
Share
Share this post:

PlotRange when combining ListLogPlots using show behaves strangely?

Posted 9 years ago

Here is an example of a simple combination of 2 ListLogPlots using Show with a specified plot range:

Show[
{ListLogPlot[{{2, 10000}}],
  ListLogPlot[{{1, 100}}]}, 
PlotRange -> {{0, 20}, {100, 100000}}]

here is the resulting plot:
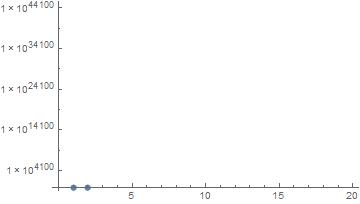
combination of ListLogPlots using Show

Does anyone know how to resolve this without specifying the plot range for the individual plots like this

Show[{
  ListLogPlot[{{2, 10000}}, PlotRange -> {{0, 20}, {100, 100000}}],
  ListLogPlot[{{1, 100}}, PlotRange -> {{0, 20}, {100, 100000}}]}]

Thanks!

POSTED BY: Eric Colegrove
3 Replies
Posted 9 years ago

Further playing around suggests that the PlotRange setting for the vertical axis with a ListLogPlot needs to give the associated logs of the limits:

Show[{ListLogPlot[{{2, 10000}}], ListLogPlot[{{1, 100}}]}, 
 PlotRange -> {{0, 20}, {Log[100], Log[100000]}}, 
 Frame -> {{True, False}, {True, False}}]

Without the use of Frame I couldn't get the horizontal axis to appear.

POSTED BY: Jim Baldwin
Posted 9 years ago

Show[{ListLogPlot[{{2, 10000}}], ListLogPlot[{{1, 100}}]}, PlotRange -> All]

Correction: The above doesn't quite do it as the horizontal axis is not as desired. The following works better:

Show[{ListLogPlot[{{2, 10000}}], ListLogPlot[{{1, 100}}]}, 
 PlotRange -> {{0, 20}, All}]
POSTED BY: Jim Baldwin
Posted 9 years ago

This works! It seems odd to me that the PlotRange limits for ListLogPlot are as expected for a single plot, but Show needs the Log of the limits when combining plots. Anyway, thank you for your help.

POSTED BY: Eric Colegrove
Reply to this discussion
Community posts can be styled and formatted using the Markdown syntax.
Reply Preview
Attachments
Remove
or Discard

Group Abstract Group Abstract