m = y[t]
NDSolve[{x'[t] == -m - x[t]^2, y'[t] == 2 x[t] - m^3,  x[0] == y[0] == 1}, {x, y}, {t, 20}]
The result show two small curves. How can I graph it on the XOT and YOT plane?
Thanks a lot.
As the manual says
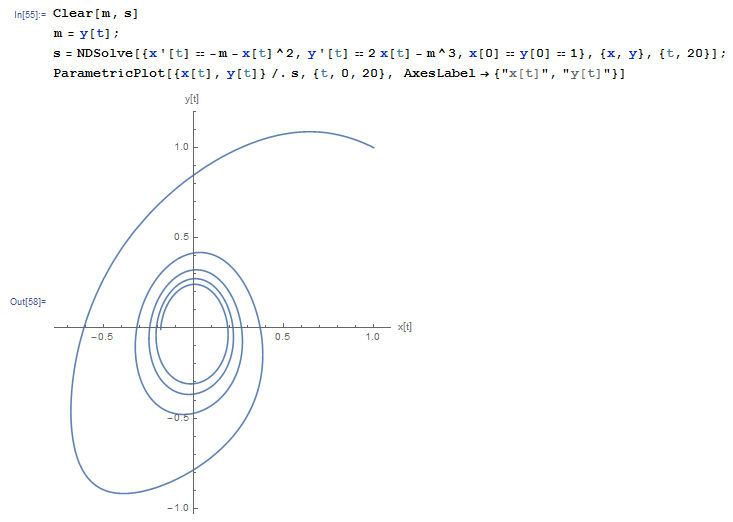
Clear[m, s]
m = y[t];
s = NDSolve[{x'[t] == -m - x[t]^2, y'[t] == 2 x[t] - m^3, x[0] == y[0] == 1}, {x, y}, {t, 20}];
ParametricPlot[{x[t], y[t]} /. s, {t, 0, 20}, AxesLabel -> {"x[t]", "y[t]"}]
with other words