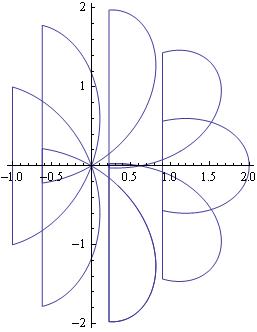
The trick to getting the vertical lines is to use Exclusions -> None as a plot option:
zr[t_] := Re[Sqrt[E^(-7 I t)] + E^(I t)]
zi[t_] := Im[Sqrt[E^(-7 I t)] + E^(I t)]
ParametricPlot[{zr[t], zi[t]}, {t, -2, 5}, MaxRecursion -> 10,  Exclusions -> None]