Hi Jos,
The label specification is not correct as Michael pointed out.
My appologies that I missed out your original question...
For a start I changed your plot:
DateListPlot[Tooltip[SelNulTen06],
 PlotLabel -> Style["Year 2006\n0...10 %", "Title", 12],
 BaseStyle -> {FontFamily -> "Arial", FontWeight -> "Bold",
   FontSize -> 11},
 Axes -> True,
 FrameLabel -> {"Months [n]", "Test [%]"},

 FrameTicks -> {{Automatic,
    Automatic}, {{{{2006, 1, 1}, "Jan"}, {{2006, 2, 1},
      "Feb"}, {{2006, 3, 1}, "Mar"}, {{2006, 4, 1},
      "Apr"}, {{2006, 5, 1}, "May"}, {{2006, 6, 1},
      "Jun"}, {{2006, 7, 1}, "Jul"}, {{2006, 8, 1},
      "Aug"}, {{2006, 9, 1}, "Sep"}, {{2006, 10, 1},
      "Okt"}, {{2006, 11, 1}, "Nov"}, {{2006, 12, 1}, "Dec"}},
    Automatic}},

 PlotRange -> {{{2005, 12, 10}, {2006, 12, 31}}, {-0.1, 10}},
 GridLines -> Automatic,
 GridLinesStyle -> Directive[Black, Dotted],
 PlotStyle -> Directive[PointSize[Medium], Red],
 Joined -> False,
 Filling -> Axis
 ]
This produces:
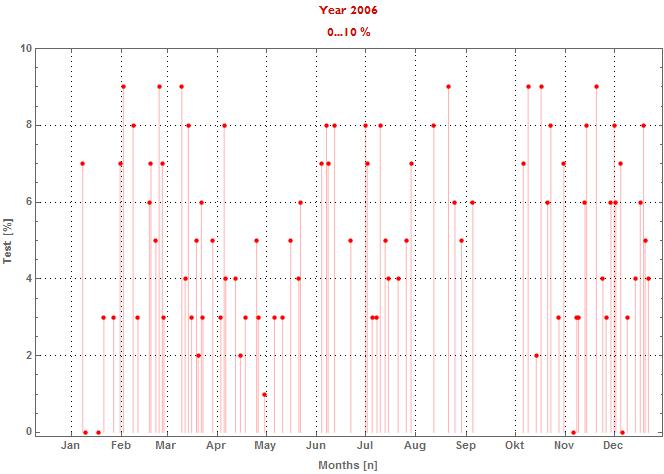
So:
- Pay attention to the ticks format (1 is not a dateformat)
- When you use a frame and want's ticks specified use FrameTicks
- When you use plotrange use some extra range to show the first label.
 Attachments:


