Hi all,
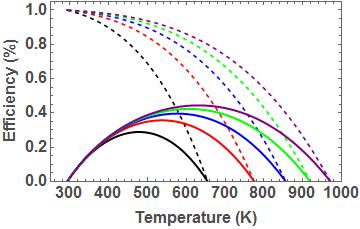
Here is what I wrote, but it is not beautiful. Do you think you can write it in a simpler and better way? Another question is I'd like to add Legends saying dashed line is "Receiver efficiency" and solid line is "system efficiency", but I couldn't do that. Any help will be very appreciable. Thank you.
ClearAll
\[Sigma] = 5.67 10^-8; "Stefan-Boltzmann Constant";
\[Epsilon] = 1; "Emissivity";
\[Alpha] = 1; "Absorbtivity";
\[Tau] = 1; "Transmittance";
g = 1 10^3; "Solar radiation 1Kw/m^2";
c = Range[10, 50, 10]; "Concentration";
receff[x_] = \[Alpha] \[Tau] - (\[Sigma] \[Epsilon] (x^4 -
      293.15^4))/(c g);
syseff[x_] = (\[Alpha] \[Tau] - (\[Sigma] \[Epsilon] (x^4 -
        293.15^4))/(c g)) (1 - 293.15/x);
Plot[Evaluate[{receff[x], syseff[x]}], {x, 293.15, 1073.15},
 PlotStyle -> {Directive[Dashed, Black], Directive[Dashed, Red],
   Directive[Dashed, Blue], Directive[Dashed, Green],
   Directive[Dashed, Purple], Directive[Thick, Black],
   Directive[Thick, Red], Directive[Thick, Blue],
   Directive[Thick, Green], Directive[Thick, Purple]}, Frame -> True,
 PlotRange -> {{250, 1000}, {0, 1.05}},
 FrameLabel -> {"Temperature (K)"  , "Efficiency (%)"},
 LabelStyle -> Directive[Black, Bold, {16, GrayLevel[0.3]}]]