Hi,
I am not sure what you want to achieve, but Plot is a procedure which needs fixed bounds for the range, such as:
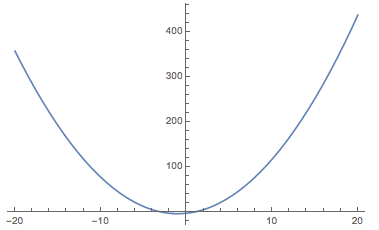
p[x_] := x^2 + 2 x - 3;
Plot[p[r], {r, -20 , 20 }]
If you want to try different ones you might want to use Manipulate:
Manipulate[Plot[p[r], {r, -2 RR , 2 RR }], {{RR, 1}, 0.1, 20}]
You will get a Slider and get get something like this:
Hope this helps,
Marco


