Message Boards Message Boards

0
|
18001 Views
|
3 Replies
|
1 Total Likes
View groups...
Share
Share this post:

London The Gherkin: plot volume of revolution in 3d

Posted 10 years ago

Hello, I am new here not sure how to plot this

x=?2.211610^(?15)y^(8)+1.360310^(?12)y^(7)-3.4289910^(?10)y^(6)+4.5686110^(?8)y^(5)-3.4506510^(?6)y^(4)+1.3934710^?4y^(3)-0.00284795y^(2)+0.0911615y+24.5 t

hen rotate it around by 360 or 2 pi to form a 3d object. May someone please help me graph this, it has a upper bound of 179.8 and lower bound of 0. This is supposed to form the famous building The Gherkin. Thanks in advance. I have tried a few times but didn't work properly.
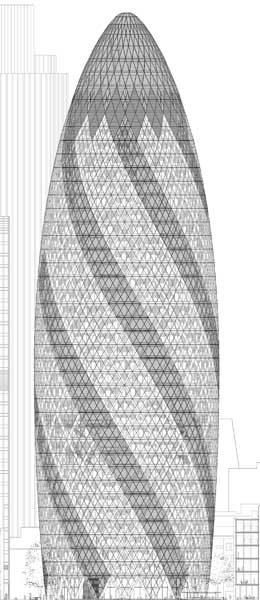
enter image description here

POSTED BY: Bob H
3 Replies

Hi Bob,

it took me a while, but now I found it! Have you seen this wolfram blog contribution on twisted architecture? It might be exactly what you are looking for.

Henrik

POSTED BY: Henrik Schachner
Posted 10 years ago
gherkinOutline[y_] := \[Minus]2.2116 10^-15 y^8 + 1.3603 10^-12 y^7 - 
      3.42899 10^-10 y^6 + 4.56861 10^-8 y^5 - 3.45065 10^-6 y^4 + 
      1.39347 10^-4 y^3 - 0.00284795 y^2 + 0.0911615 y + 24.5

RevolutionPlot3D[{gherkinOutline[t], t, 0}, {t, 0, 179.8}, 
 RevolutionAxis -> {0, 1, 0}]

enter image description here

Check also this: http://blog.wolfram.com/2009/09/11/twisted-architecture/

POSTED BY: Hans Milton
Posted 10 years ago

I know i am supposed to use RevolutionPlot3D but not sure how to rotate the above function around the y-axis

POSTED BY: Bob H
Reply to this discussion
Community posts can be styled and formatted using the Markdown syntax.
Reply Preview
Attachments
Remove
or Discard

Group Abstract Group Abstract