Message Boards Message Boards

0
|
2759 Views
|
3 Replies
|
0 Total Likes
View groups...
Share
Share this post:
GROUPS:

How to draw bounding surfaces with Plot3D?

Posted 9 years ago

Hi. I started with Mathematica and have some troubles.

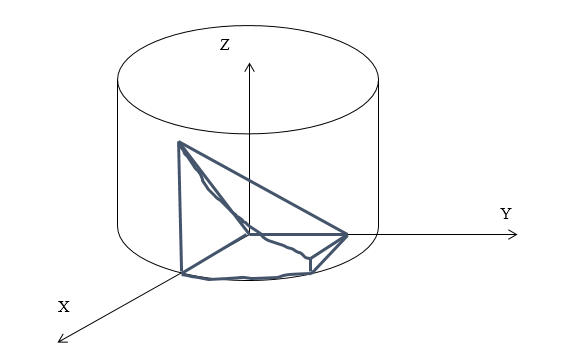
I need to figure bounded by a given surfaces:

z = 0; z = x; y = 0; y = 4; x = sqrt(25 - y^2)

I try to reproduce that in Mathematica, but makes something wrong and don't understand how to make it right

In documentation I find Plot3D function and try using it.

f[x_, y_] := 0;
g[x_, y_] := x;
h[x_] := 0;
m[x_] := 4;
b[y_] := sqrt (25 - y^2);

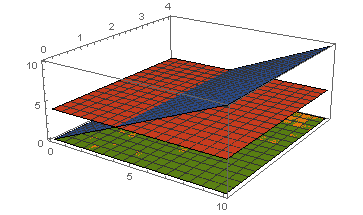
Plot3D[{f[x, y], g[x, y], h[x], m[x], b[y]}, {x, 0, 10}, {y, 0, 4}]

And getting something like this:

enter image description here

My friend gave me this image that he made himself by hand, but I'm not sure how much it is correct, and decided to do the same automatically using Mathematica

enter image description here

POSTED BY: Daniil Mikhailov
3 Replies
Posted 9 years ago

You could use RegionPlot3D, but your curves do not appear to bound an enclosed volume.

POSTED BY: David Keith

Thank you, but RegionPlot3D working with predicates. Try it but nothing

RegionPlot3D[
 y >= 0 && y <= 4 && x >= 0 && x <= sqrt (25 - y^2) && z >= 0 && z <= x ,
 {x, -10, 10}, {y, -10, 10}, {z, -10, 10}
]

enter image description here

POSTED BY: Daniil Mikhailov
Posted 9 years ago

In Mathematica, Sqrt[x], not, sqrt(x}. Make sure your syntax is correct and the predicate resolves to True or False only.

POSTED BY: David Keith
Reply to this discussion
Community posts can be styled and formatted using the Markdown syntax.
Reply Preview
Attachments
Remove
or Discard

Group Abstract Group Abstract