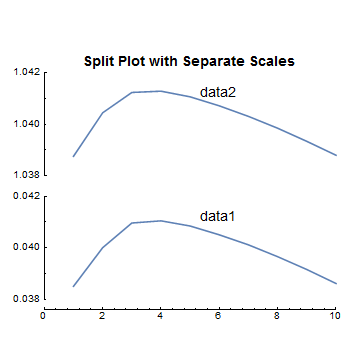
How about this that I drew with the Presentations Application that I sell through my web site. I essentially draw on a blank sheet of paper and use custom X and Y tick scales. The list plot results are scaled and shifted into position on the paper. I used Eric's data.
<< Presentations`
data1 = {{1, 0.0385}, {2, 0.04}, {3, 0.04096}, {4, 0.041044}, {5, 0.0408417}, {6, 0.0405}, {7, 0.04011}, {8, 0.03965}, {9, 0.0391528}, {10, 0.03861}};
data2 = {{1, 1.0386}, {2, 1.04029}, {3, 1.04108}, {4, 1.04113}, {5, 1.04091}, {6, 1.04056}, {7, 1.04015}, {8, 1.03969}, {9, 1.03918}, {10, 1.03864}};
The following draws the graphic. This has the advantage of a single x axis and it was easy to add Text labels.
Draw2D[
 {ListDraw[data1, Joined -> True] //
    ScaleOp[{1, 1/0.004}, {0, 0.038}] // TranslateOp[{0, -0.038}],
  ListDraw[data2, Joined -> True] //
    ScaleOp[{1, 1/0.004}, {0, 1.038}] // TranslateOp[{0, 0.2}],
  Text[Style["data1", 14], {6, 0.8}],
  Text[Style["data2", 14], {6, 2}],
  XTickLine[{0, 10, -0.1}, {0, 10}, {0, 10, 2}, 5],
  YTickLine[{0, 1, 0}, {0.038, 0.042}, {0.038, 0.042, 0.002}, 2,
   YTextSpecs -> {{1, 0}, {1, 0}, 0.008},
   YNumberFunction -> (If[# == 0, 0, NumberForm[#, {4, 3}]] &)],
  YTickLine[{1.2, 2.2, 0}, {1.038, 1.042}, {1.038, 1.042, .002}, 2,
   YTextSpecs -> {{1, 0}, {1, 0}, 0.008},
   YNumberFunction -> (NumberForm[#, {4, 3}] &)],
  Text[Style["Split Plot with Separate Scales", 14, Bold], {5, 2.3}]
  },
 AspectRatio -> 1,
 PlotRange -> {{-1, 10}, {0, 2.4}},
 PlotRangePadding -> 0.5,
 Frame -> None,
 ImageSize -> 350]
