Message Boards Message Boards

0
|
6301 Views
|
9 Replies
|
0 Total Likes
View groups...
Share
Share this post:
GROUPS:

Plotting two graps with commen X-axis

Posted 9 years ago

Find the problem in Attached file.

Thanks in Advance

Attachments:
POSTED BY: abhishek sharma
9 Replies
Posted 9 years ago
Show[{
  ListPlot[List1, Joined->True], 
  ListPlot[Map[# - {0, .997} &, List2], Joined->True]
 }, PlotRange->All, Axes->{True, False}]

Look up each of those words in the help system and study them until you can understand how and why this was done.

POSTED BY: Bill Simpson

enter image description here

POSTED BY: Simon Cadrin

Thanks Simon.. But Method does not gives the accurate figure.. Because In this Way Both the Graphs of List1 and LIst2 looses their original shape.

POSTED BY: abhishek sharma

Thanks for kind reply But in this way their is one problem... I wish I could Draw an independent Y axis for List2

POSTED BY: abhishek sharma

How about

l1 = ListPlot[{{1, 0.0385}, {2, 0.04}, {3, 0.04096}, {4, 
    0.041044}, {5, 0.0408417}, {6, 0.0405}, {7, 0.04011}, {8, 
    0.03965}, {9, 0.0391528}, {10, 0.03861}}, Joined -> True]

l2 = ListPlot[{{1, 1.0386}, {2, 1.04029}, {3, 1.04108}, {4, 
    1.04113}, {5, 1.04091}, {6, 1.04056}, {7, 1.04015}, {8, 
    1.03969}, {9, 1.03918}, {10, 1.03864}}, Joined -> True]

Column[{l1, l2}]

POSTED BY: Eric Johnstone
Posted 9 years ago

You are free to draw independent axes if you wish

o = .997;(*Offset to upper plot*)
Show[{ListPlot[List1, Joined -> True],
  Graphics[{Text["0.039", {.5, .039}], Text["0.040", {.5, .040}], Text["0.041", {.5, .041}]}],
  Graphics[Line[{{.7, .039}, {.9, .039}, {.8, .039}, {.8, .040}, {.7, .040}, {.9, .040}, {.8, .040},
     {.8, .041}, {.7, .041}, {.9, .041}}]],
  ListPlot[Map[# - {0, o} &, List2], Joined -> True],
  Graphics[{Text["1.039", {.5, 1.039-o}], Text["1.040", {.5, 1.040-o}], Text["1.041", {.5, 1.041-o}]}],
  Graphics[Line[{{.7, 1.039-o}, {.9, 1.039-o}, {.8, 1.039-o}, {.8, 1.040-o}, {.7, 1.040-o},
     {.9, 1.040-o}, {.8, 1.040-o}, {.8, 1.041-o}, {.7, 1.041-o}, {.9, 1.041-o}}]]
  }, PlotRange -> {{.25, 10}, {.035, .045}}, Axes -> {True, False}]

Two plots with an offset and constructed y axes

Based on responses from other users who have been dissatisfied with the built-in graphics functions, I suspect you may not find this acceptable either. If that is the case then you might consider creating two separate plots, exporting those, importing those into a high-end publishing product and using it to produce the image that you desire. Someone wrote "if it takes x time to get the data and mathematics almost correct then it usually takes between 3x and 10x to get the graphics almost correct and 10x to infinity to get the graphics exactly the way you want them."

POSTED BY: Bill Simpson

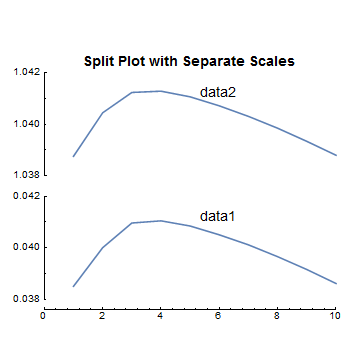
How about this that I drew with the Presentations Application that I sell through my web site. I essentially draw on a blank sheet of paper and use custom X and Y tick scales. The list plot results are scaled and shifted into position on the paper. I used Eric's data.

<< Presentations`
data1 = {{1, 0.0385}, {2, 0.04}, {3, 0.04096}, {4, 0.041044}, {5, 0.0408417}, {6, 0.0405}, {7, 0.04011}, {8, 0.03965}, {9, 0.0391528}, {10, 0.03861}};
data2 = {{1, 1.0386}, {2, 1.04029}, {3, 1.04108}, {4, 1.04113}, {5, 1.04091}, {6, 1.04056}, {7, 1.04015}, {8, 1.03969}, {9, 1.03918}, {10, 1.03864}};

The following draws the graphic. This has the advantage of a single x axis and it was easy to add Text labels.

Draw2D[
 {ListDraw[data1, Joined -> True] // 
    ScaleOp[{1, 1/0.004}, {0, 0.038}] // TranslateOp[{0, -0.038}],
  ListDraw[data2, Joined -> True] // 
    ScaleOp[{1, 1/0.004}, {0, 1.038}] // TranslateOp[{0, 0.2}],
  Text[Style["data1", 14], {6, 0.8}],
  Text[Style["data2", 14], {6, 2}],
  XTickLine[{0, 10, -0.1}, {0, 10}, {0, 10, 2}, 5],
  YTickLine[{0, 1, 0}, {0.038, 0.042}, {0.038, 0.042, 0.002}, 2, 
   YTextSpecs -> {{1, 0}, {1, 0}, 0.008},
   YNumberFunction -> (If[# == 0, 0, NumberForm[#, {4, 3}]] &)],
  YTickLine[{1.2, 2.2, 0}, {1.038, 1.042}, {1.038, 1.042, .002}, 2, 
   YTextSpecs -> {{1, 0}, {1, 0}, 0.008},
   YNumberFunction -> (NumberForm[#, {4, 3}] &)],
  Text[Style["Split Plot with Separate Scales", 14, Bold], {5, 2.3}]
  },
 AspectRatio -> 1,
 PlotRange -> {{-1, 10}, {0, 2.4}},
 PlotRangePadding -> 0.5,
 Frame -> None,
 ImageSize -> 350]

enter image description here

l1 = ListPlot[{{1, 0.0385}, {2, 0.04}, {3, 0.04096}, {4, 
        0.041044}, {5, 0.0408417}, {6, 0.0405}, {7, 0.04011}, {8, 
        0.03965}, {9, 0.0391528}, {10, 0.03861}}, Joined -> True, 
      Axes -> {False, True}]

    l2 = ListPlot[{{1, 1.0386}, {2, 1.04029}, {3, 1.04108}, {4, 
        1.04113}, {5, 1.04091}, {6, 1.04056}, {7, 1.04015}, {8, 
        1.03969}, {9, 1.03918}, {10, 1.03864}}, Joined -> True]

    Column[{l1, l2}]

POSTED BY: Eric Johnstone

Thanks to all.. for their useful disscussion

POSTED BY: abhishek sharma
Reply to this discussion
Community posts can be styled and formatted using the Markdown syntax.
Reply Preview
Attachments
Remove
or Discard

Group Abstract Group Abstract