You are free to draw independent axes if you wish
o = .997;(*Offset to upper plot*)
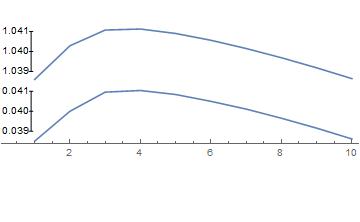
Show[{ListPlot[List1, Joined -> True],
Graphics[{Text["0.039", {.5, .039}], Text["0.040", {.5, .040}], Text["0.041", {.5, .041}]}],
Graphics[Line[{{.7, .039}, {.9, .039}, {.8, .039}, {.8, .040}, {.7, .040}, {.9, .040}, {.8, .040},
{.8, .041}, {.7, .041}, {.9, .041}}]],
ListPlot[Map[# - {0, o} &, List2], Joined -> True],
Graphics[{Text["1.039", {.5, 1.039-o}], Text["1.040", {.5, 1.040-o}], Text["1.041", {.5, 1.041-o}]}],
Graphics[Line[{{.7, 1.039-o}, {.9, 1.039-o}, {.8, 1.039-o}, {.8, 1.040-o}, {.7, 1.040-o},
{.9, 1.040-o}, {.8, 1.040-o}, {.8, 1.041-o}, {.7, 1.041-o}, {.9, 1.041-o}}]]
}, PlotRange -> {{.25, 10}, {.035, .045}}, Axes -> {True, False}]
Based on responses from other users who have been dissatisfied with the built-in graphics functions, I suspect you may not find this acceptable either. If that is the case then you might consider creating two separate plots, exporting those, importing those into a high-end publishing product and using it to produce the image that you desire. Someone wrote "if it takes x time to get the data and mathematics almost correct then it usually takes between 3x and 10x to get the graphics almost correct and 10x to infinity to get the graphics exactly the way you want them."


