It seems that DateListPlot when used in webMathematica (3.3.1) show different output than in desktop Mathematica (10.1).
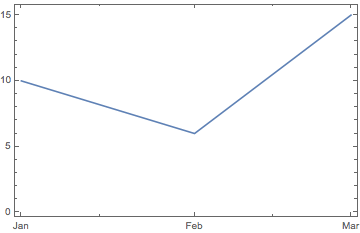
In desktop Mathematica, if you evalutate
data = {{{2015, 1}, 10}, {{2015, 2}, 6}, {{2015, 3}, 15}};
DateListPlot[data]
will show this picture:

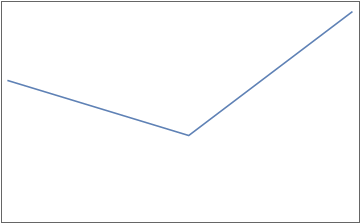
in webMathematica instead, when you call this code (html removed for clarity) in .jsp file from your browser
 <msp:evaluate>
      data = {{{2015, 1}, 10}, {{2015, 2}, 6}, {{2015, 3}, 15}};
      MSPShow[DateListPlot[data]]
 </msp:evaluate>
it will show the graph without the vertical and horizontal Ticks:

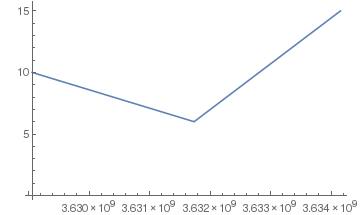
Then I've tried to add FrameTicks -> True (and Frame-> False otherwise it doesn't show them)
<msp:evaluate>
      data = {{{2015, 1}, 10}, {{2015, 2}, 6}, {{2015, 3}, 15}};
      MSPShow[
         DateListPlot[data
           ,Frame-> False
           ,FrameTicks -> True]]
    </msp:evaluate>
the output now shows the ticks, but in Scientific Notation. No way to display the ticks in date format:

It appears as a bug for me, because other functions as Plot[] or ListPlot[] produce a regular output. This strange behavior seems to be peculiar to DateListPlot[].
Does anyone has encountered the same problem or found a workaround?
(I've posted this question also on StackExchange )