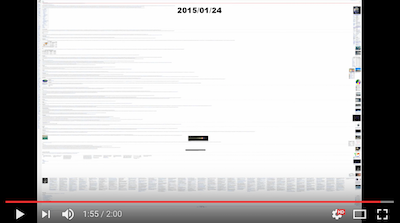
At the Wikipedia picnic in Atlanta last year, we discussed making time lapse animations of article edits. I put together some code last year, and made another animation this year. Vitaliy suggested I do a post about it. Perhaps you will find some useful tips. The final result is here:

I used the Earth article for this year's animation. It has been a featured article since 2007. The first step is to import the edit history of your target article. Unfortunately, the newly added WikipediaData function doesn't help us here, and the MediaWiki API actually just made this process slightly more complicated (presumably to help preserve their very high performance standards). You can download the revision ID, date, and size of past article revisions by constructing a URL similar to this:
Import["http://en.wikipedia.org/w/api.php?format=json&action=query&\
titles=Earth&prop=revisions&rvprop=ids|timestamp|size&rvlimit=500&\
continue=", "JSON"]
That will give you 500 results, which is the most you can download in a single request. The result will contain extra parameters to add to get the next page of results. To get the next 500 results we construct a URL like this:
Import["http://en.wikipedia.org/w/api.php?format=json&action=query&\
titles=Earth&prop=revisions&rvprop=ids|timestamp|size&rvlimit=500&\
continue=||&rvcontinue=20140718203435|617498745", "JSON"]
You keep downloading the next page until the result doesn't contain any continuation information. To make the result easier to work with I convert the results to associations with a Replace like this:
Replace[json, a : {__Rule} -> <|a|>, {0, \[Infinity]}]
My understanding is that you will be able to import the JSON as an association automatically in the upcoming 10.2 update. So if we package all of this together in a NestWhileList and then format the dates and sort the revisions we get something like:
revisions =
  Join @@ NestWhileList[
       Replace[Import[
          "http://en.wikipedia.org/w/api.php?format=json&action=query&\
titles=" <> URLEncode@article <>
           "&prop=revisions&rvprop=ids|timestamp|size&rvlimit=500" <>
           StringJoin@*KeyValueMap["&" <> # <> "=" <> #2 &]@#[[
             "continue"]], "JSON"],
         a : {__Rule} -> <|a|>, {0, \[Infinity]}] &, <|
        "continue" -> <|"continue" -> ""|>|>, KeyExistsQ@"continue"][[
      2 ;;, "query", "pages", 1, "revisions",
      All, {"revid", "timestamp", "size"}]] //
    MapAt[DateList, #, {All, "timestamp"}] & // SortBy[#timestamp &];
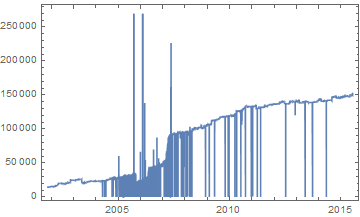
OK, so this gives us about 11,000 revisions for this article. Let's look at how the size changes over time.
DateListPlot[revisions[[All, {"timestamp", "size"}]], Joined -> True]

The size here is measured in characters of wiki markup. The spikes are caused by vandalism. The downward spikes are from when someone deletes the article text (called blanking). The upward spikes are often from people inserting long spam advertising messages. Fortunately, the amount of this type of vandalism seems to be decreasing on this article. Checking the protection logs for the article, we can see that its current indefinite semi-protection was applied in 2010. This type of vandalism is typically caught and undone very quickly. We can save time while producing the animation by filtering out revisions that stayed current for less than the time covered by a single frame. We'll plan for the animation to last for 2 minutes at 30 frames per second.
DateDifference @@ revisions[[{1, -1}, "timestamp"]]/(60*2*30)
So each frame will span a little less than 1.4 days. Let's keep only the revisions that lasted for more than 1.3 days.
filteredRevisions =
  Select[Partition[revisions, 2, 1],
    DateDifference @@ #[[All, "timestamp"]] >
      Quantity[1.3, "Days"] &][[All, 1]];
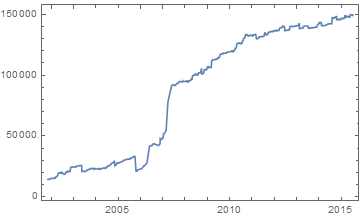
So this leaves us with 1008 revisions with the following size progression for our animation.

The size of the wiki markup doesn't correspond exactly to the displayed size of the article in the browser, due to the varying size of added and removed images and some content being split into multiple columns when put in a table or the references.
Now we are going to save large images of each of these revisions of the article and then copy, resize, and compose dates onto them to produce the animation. To render the images we will use the open-source PhantomJS headless browser that companies like Twitter and Netflix use to help automate website testing. PhantomJS is a self-contained executable that you control by feeding it a JavaScript file. We'll just use a simple script that tells it to export an image of a page.
var page = require('webpage').create();
page.viewportSize = { width: 13000, height: 1024 };
var system = require('system');
page.open(system.args[1], function() {
  page.render(system.args[2]);
  phantom.exit();
});
I needed to use a very large width because we are trying to fit a large Wikipedia article within the aspect ratio of a frame of video. To run PhantomJS, run a command like the following.
phantomjs render.js "http://en.wikipedia.org/w/index.php?title=Earth&oldid=665045756" frames/665045756.png
I selected that revision as a test to find an appropriate width because it was the largest revision. Once you've settled on a width for your PhantomJS script we need to run it for all of the revisions that we want. We could parallelize this, but I think it's considered polite to not parallelize tasks that involve repeatedly querying a web service. This will also keep our computer more responsive if we want to use it for other things while this task is completing. I used Monitor to add a quick progress bar. Once you know your Run["program"] command is working with an external program, you can switch it to a Get["!program"] call to hide the console window that pops up. I included a FinishDynamic[] because such a simple Map with only an external program call can tend to not give the front end a quick break to update our progress bar.
i = 0; Monitor[(i++; FinishDynamic[];
    Get@StringRiffle@{"!phantomjs", "render.js",
       "\"http://en.wikipedia.org/w/index.php?title=" <>
        URLEncode@article <> "&oldid=" <> # <> "\"",
       "frames/" <> # <> ".png"}) & /@
  ToString /@ filteredRevisions[[All, "revid"]],
 Row@{ProgressIndicator[i/Length@filteredRevisions], "  ", i, " of ",
   Length@filteredRevisions}]
Once this is finished you've probably generated a few gigs of screenshots. Now we need to generate a list of dates and revisions that correspond to each frame in the final animation. The basic idea is to use Subdivide to generate a list of absolute times that correspond to each frame. Then we use BinLists with the times of the revisions as bins to group the frames by which revision they will display. Then we use Thread, Apply, and Map a few times to match the revision IDs back up and format the output.
frames = MapIndexed[<|"frame" -> #2[[1]], "date" -> #[[1]],
    "revision" -> #[[2]]|> &,
  Flatten[Thread@{DateList[#][[;; 3]] & /@ #, #2} & @@@
    Thread@{BinLists[
       Subdivide[#, #2,
          120.*30 -
           1] & @@ (AbsoluteTime /@ {filteredRevisions[[1,
             "timestamp"]], DateList[]}), {Append[
         AbsoluteTime /@ filteredRevisions[[All, "timestamp"]],
         AbsoluteTime[]]}], filteredRevisions[[All, "revid"]]}, 1]]
The output will be something like
{<|"frame" -> 1, "date" -> {2001, 11, 6}, "revision" -> 342428310|>,..., <|"frame" -> 3600, "date" -> {2015, 7, 13},
  "revision" -> 670687112|>}
Now we just have to generate an image from the description of each frame by resizing one of the images we saved earlier and composing a date on top of it. I determined the dimensions to use for resizing, padding, and cropping by testing the image from the largest revision separately. Some video formats require your dimensions to be even numbers. You will want to parallelize this part, so remember to share your progress indicator variable across the kernels first. You could save some more time by resizing each of your screenshots first and saving those instead of resizing them for each generated final frame, but I had some other things to do yesterday, so that wasn't a priority for me.
i = 0; SetSharedVariable@i; Monitor[
 ParallelMap[(i++;
    Export["E:\\Wikipedia timelapse\\output\\" <> ToString@#frame <>
      ".png", ImageCompose[
      ImageCrop[
       ImageTake[
        ImageResize[
         Import["E:\\Wikipedia timelapse\\frames\\" <>
           ToString@#revision <> ".png"], 1544], 1080], {1544, 1080},
       Top, Padding -> "Fixed"],
      Rasterize[
       Style[DateString[#date, {"Year", "/", "Month", "/", "Day"}],
        36, FontFamily -> "Arial Black"], Background -> None],
      Scaled@{.5, .95}]]) &, frames],
 Row@{ProgressIndicator[i/Length@frames], "  ", i, " of ",
   Length@frames}]
This will likely take several hours if you chose an article of decent size and popularity. Once all of your final frames are generated you just have to stitch them together into a video file. In principle Mathematica can do this, but for anything other than very small, short videos, I recommend using open-source Blender to stitch the images into a video. Blender can do a lot of things related to 3D graphics and video editing, so the interface can be pretty overwhelming. Here is a short video that shows you just how to turn an image sequence into a video.
Enjoy!