Message Boards Message Boards

0
|
3346 Views
|
3 Replies
|
1 Total Likes
View groups...
Share
Share this post:

Kindly look for help with solving an eigenvalue equation, thanks :)

Posted 9 years ago

Hi, I am trying to solve the following eigenvalue equation for \Beta as the propagation constant in my problem:

f[\[Beta]_] := 
 BesselJ[0, h[\[Beta]]*a]/h[\[Beta]]/a/
   BesselJ[1, h[\[Beta]]*a] + (n1^2 + n2^2)*
   KD1[q[\[Beta]]*a]/q[\[Beta]]/a/BesselK[1, q[\[Beta]]*a] - 
  1/h[\[Beta]]^2/a^2 + 
  Sqrt[((n1^2 - n2^2)*
      KD1[q[\[Beta]]*a]/2/n1^2/q[\[Beta]]/a/
       BesselK[1, 
        q[\[Beta]]*a])^2 + \[Beta]^2*(1/q[\[Beta]]^2/a^2 + 
         1/h[\[Beta]]^2/a^2)^2/n1^2/k^2]

be letting f[[Beta]_] ==0. The parameters in the above equation are defined as follows:

a = 0.2*10^-6; n1 = 1.4469; n2 = 1.0;
\[Lambda] = 1.3*10^-6; k = 2 \[Pi]/\[Lambda];
h[\[Beta]_] := Sqrt[n1^2*k^2 - \[Beta]^2];
q[\[Beta]_] := Sqrt[\[Beta]^2 - n2^2*k^2];
JD1[x_] := BesselJ[0, x] - BesselJ[1, x]/x;
KD1[x_] := -(BesselK[0, x] + BesselK[2, x])/2;

I tried NSolve and FindRoot but they do not work. Does anyone know what would be the best way to solve this type of problem? For your convenience, I also attached the .nb file with this discussion so you can directly download and have a try if you want :) Thanks a lot! Di

Attachments:
POSTED BY: Di Chang
3 Replies

Sorry I just saw it. Thank you very much for the above help. I got the problem solved by finding an error in the equation itself so no problem now. Thank you all for the time and help! :)

POSTED BY: Di Chang

Thanks, but seems that it also has problem with plotting...the vertical axis is not plotting to the right scale actually :(

POSTED BY: Di Chang
Posted 9 years ago

Hint:

Plot[Re[f[\[Beta]]], {\[Beta], -10, 10}]

enter image description here

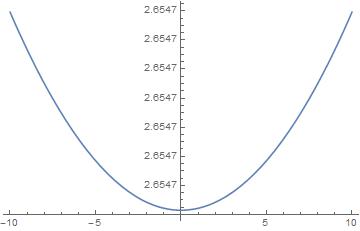
Seems to plot without problems showing that there is no f[beta]==0 but rather a minimum that is far from zero.

The function is so near constant over -10<beta<10 that 5 digits is inadequate to show the scale with enough precision.

What do you want the plot to be? You can add PlotRange -> {-1, 3} to the plot if you prefer to see it that way.

One other possible problem is that you are using floating point numbers with only a single digit of precision in your notebook.

If you change all those constants to exact rational numbers then you can see this

In[8]:= Table[{N[\[Beta]], N[f[\[Beta]], 20]}, {\[Beta], -5, 5, 1}]

Out[8]= {
   {-5., 2.6546952405717024423 + 2.7166456587854339284 I},
   {-4., 2.6546952405704768852 + 2.7166456587851677216 I},
   {-3., 2.6546952405695236741 + 2.7166456587849606719 I},
   {-2., 2.6546952405688428091 + 2.7166456587848127792 I},
   {-1., 2.6546952405684342900 + 2.7166456587847240436 I},
   { 0., 2.6546952405682981170 + 2.7166456587846944650 I},
   { 1., 2.6546952405684342900 + 2.7166456587847240436 I},
   { 2., 2.6546952405688428091 + 2.7166456587848127792 I},
   { 3., 2.6546952405695236741 + 2.7166456587849606719 I},
   { 4., 2.6546952405704768852 + 2.7166456587851677216 I},
   { 5., 2.6546952405717024423 + 2.7166456587854339284 I}}

and hopefully all those digits are correct.

POSTED BY: Bill Simpson
Reply to this discussion
Community posts can be styled and formatted using the Markdown syntax.
Reply Preview
Attachments
Remove
or Discard

Group Abstract Group Abstract