Hint:
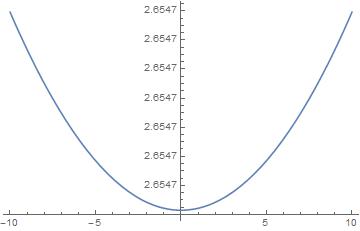
Plot[Re[f[\[Beta]]], {\[Beta], -10, 10}]

Seems to plot without problems showing that there is no f[beta]==0 but rather a minimum that is far from zero.
The function is so near constant over -10<beta<10 that 5 digits is inadequate to show the scale with enough precision.
What do you want the plot to be? You can add PlotRange -> {-1, 3} to the plot if you prefer to see it that way.
One other possible problem is that you are using floating point numbers with only a single digit of precision in your notebook.
If you change all those constants to exact rational numbers then you can see this
In[8]:= Table[{N[\[Beta]], N[f[\[Beta]], 20]}, {\[Beta], -5, 5, 1}]

Out[8]= {
   {-5., 2.6546952405717024423 + 2.7166456587854339284 I},
   {-4., 2.6546952405704768852 + 2.7166456587851677216 I},
   {-3., 2.6546952405695236741 + 2.7166456587849606719 I},
   {-2., 2.6546952405688428091 + 2.7166456587848127792 I},
   {-1., 2.6546952405684342900 + 2.7166456587847240436 I},
   { 0., 2.6546952405682981170 + 2.7166456587846944650 I},
   { 1., 2.6546952405684342900 + 2.7166456587847240436 I},
   { 2., 2.6546952405688428091 + 2.7166456587848127792 I},
   { 3., 2.6546952405695236741 + 2.7166456587849606719 I},
   { 4., 2.6546952405704768852 + 2.7166456587851677216 I},
   { 5., 2.6546952405717024423 + 2.7166456587854339284 I}}
and hopefully all those digits are correct.