Hello,
I am working on project that requires the visualization of the nucleation of calcium in a cell model. I am using the brand new ListDensiytPlot3D function to plot a run at different times. However, the colour scheme of the plots are auto-scaled, and I am assuming this is based on the standard deviation of the data. At any rate, I need the same scaling for all my plots. I tried ColorFunctionScaling -> False but that made it even worse by limiting my plots to only two colours.
Here is my code for four data files:
frameListSmall1 =
  Import["/home/varderes/QTProjects/build-RestreppoCell-Desktop_Qt_5_\
4_0_GCC_64bit-Debug/cpFullCellDensity1.txt", "Table"];
smallCellPlot1 =
  ListDensityPlot3D[frameListSmall1, BoxRatios -> Automatic,
   ColorFunction -> "Rainbow", ViewPoint -> {1, 1, 1},
   PlotLegends -> Automatic];
frameListSmall2 =
  Import["/home/varderes/QTProjects/build-RestreppoCell-Desktop_Qt_5_\
4_0_GCC_64bit-Debug/cpFullCellDensity2.txt", "Table"];
smallCellPlot2 =
  ListDensityPlot3D[frameListSmall2, BoxRatios -> Automatic,
   ColorFunction -> "Rainbow", ViewPoint -> {1, 1, 1},
   PlotLegends -> Automatic];
frameListSmall3 =
  Import["/home/varderes/QTProjects/build-RestreppoCell-Desktop_Qt_5_\
4_0_GCC_64bit-Debug/cpFullCellDensity3.txt", "Table"];
smallCellPlot3 =
  ListDensityPlot3D[frameListSmall3, BoxRatios -> Automatic,
   ColorFunction -> "Rainbow", ViewPoint -> {1, 1, 1},
   PlotLegends -> Automatic];
frameListSmall4 =
  Import["/home/varderes/QTProjects/build-RestreppoCell-Desktop_Qt_5_\
4_0_GCC_64bit-Debug/cpFullCellDensity4.txt", "Table"];
smallCellPlot4 =
  ListDensityPlot3D[frameListSmall4, BoxRatios -> Automatic,
   ColorFunction -> "Rainbow", ViewPoint -> {1, 1, 1},
   PlotLegends -> Automatic];

GraphicsGrid[{{smallCellPlot1, smallCellPlot2}, {smallCellPlot3,
   smallCellPlot4}}]
Here is an image of the graphics grid: 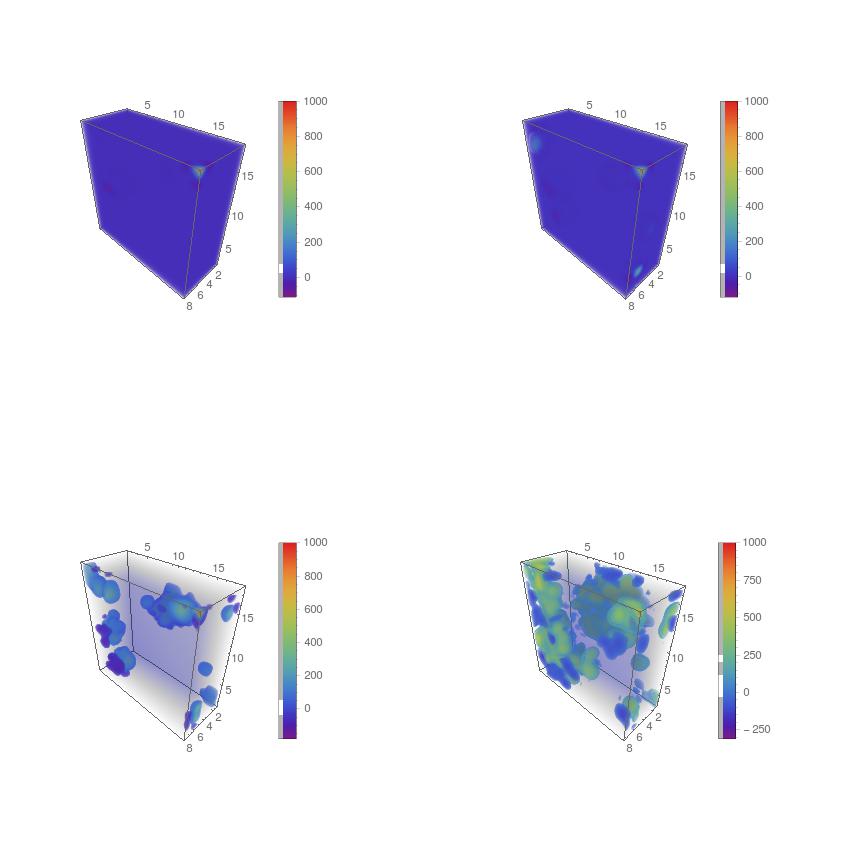
I have attached the data files as well.
Also, would it be possible to animate the entire model at once. I did this with separate time files and put the plots into a ListAnimate function. I worked fine except the colour scaling function mentioned above. But with 150 seconds of data evolving in steps of 0.1 it would take a very long time to plot each data file individually. What would be the best way to do this?
Thank you so much for taking the time to help us. Just note that my initial problem is of most importance. The animating is just for visualization purposes. -Varderes, California State University-Northridge
 Attachments:


