.
In[1]:= raw = Import["2015-06-25_TemperatureValues.xls"];
data = Map[Flatten[{AbsoluteTime[#[[1]]], Rest[#]}] &, Drop[First[raw], 7]]

Out[2]= {{-86399.96300000000000000, 32.17, 34.96},
 {-86399.92600000000000000, 32.17, 34.96},
 {-86399.8890000000000000, 32.17, 34.96},
 {-86399.8520000000000000, 32.17, 34.96},
 {-86399.8150000000000000, 32.17, 34.96},
 {-86399.7780000000000000, 32.17, 34.96},
 {-86399.7410000000000000, 32.17, 34.96},
 {-86399.7040000000000000, 32.17, 34.96},
 {-86399.6670000000000000, 32.17, 34.96},
 {-86399.6300000000000000, 32.17, 34.96},
 {-86399.5930000000000000, 32.17, 34.96},
 {-86399.5560000000000000, 32.17, 34.96}}

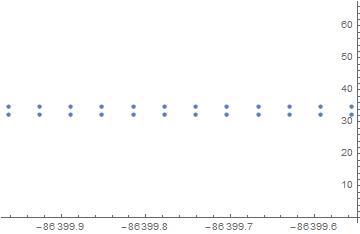
In[3]:= g1 = Show[ListPlot[Map[{#[[1]], #[[2]]} &, data]],
  ListPlot[Map[{#[[1]], #[[3]]} &, data]]]

In[4]:= raw = Import["testdata.txt"];
data = Map[Flatten[{AbsoluteTime[#[[1]]], ToExpression[Rest[#]]}] &,
  Map[StringSplit[#, "\t"] &, StringReplace[Rest[StringSplit[raw, "\n"]], "," -> "."]]]

Out[5]= {{3629059200, 37, 32.17, 34.96},
 {3629059200, 74, 32.17, 34.96},
 {3629059200, 111, 32.17, 34.96},
 {3629059200, 148, 32.17, 34.96},
 {3629059200, 37, 32.17, 34.96},
 {3629059200, 74, 32.17, 34.96},
 {3629059200, 111, 32.17, 34.96},
 {3629059200, 148, 32.17, 34.96},
 {3629059200, 185, 32.17, 34.96},
 {3629059200, 222, 32.17, 34.96},
 {3629059200, 259, 32.17, 34.96},
 {3629059202, 333, 32.17, 34.96},
 {3629059203, 370, 32.17, 34.96}}

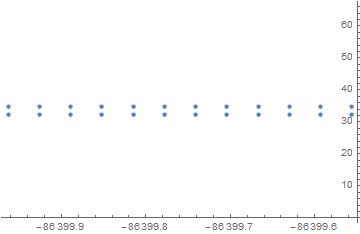
In[6]:= g2 = Show[ListPlot[Map[{#[[1]], #[[3]]} &, data]],
  ListPlot[Map[{#[[1]], #[[4]]} &, data]]]
