Hello,
I have a problem regarding the color of my plots. This is my code. You can find the used data in the attachment.
dataOffOffOff = Import["Final/Resonance/(03.08.2015)(12-30-46).FreqScan.Data.txt", "Table"];
dataOnOffOff = Import["Final/Resonance/(03.08.2015)(13-00-26).FreqScan.Data.txt", "Table"];

<< PlotLegends`
<< Errorbarplots`
<< Errorbarlogplots`

OffOffOff = Table[{dataOffOffOff[[i, {1, 2}]], ErrorBar[dataOffOffOff[[i, 3]]]}, {i, 2, Length[dataOffOffOff]}];
OnOffOff = Table[{dataOnOffOff[[i, {1, 2}]], ErrorBar[dataOnOffOff[[i, 3]]]}, {i, 2, Length[dataOnOffOff]}];

OnOffOffPlot =
 LangPlot = ErrorListLogLinearPlot[{OnOffOff}, PlotLegends -> {"OnOffOff"},
   PlotRange -> Full, Frame -> True, FrameLabel -> {"Frequenz [Hz]", "Amplitude [mV]"},
   LabelStyle -> {FontFamily -> "Times New Roman", 12, GrayLevel[0]}, ImageSize -> Medium,
   PlotStyle -> {Thickness[0.002], PointSize[0.007]}, Joined -> True, GridLines -> Automatic,
   GridLinesStyle -> Directive[Dotted, GrayLevel[0.80], Thickness[0.002]]]
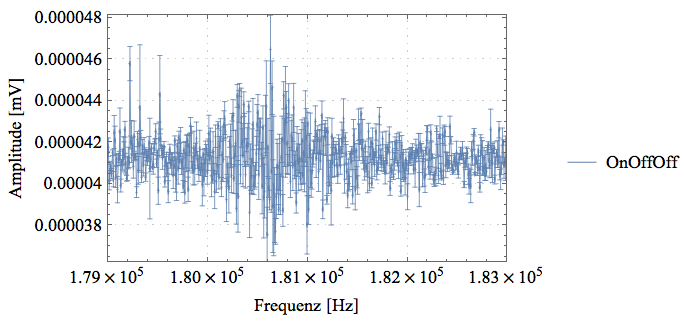
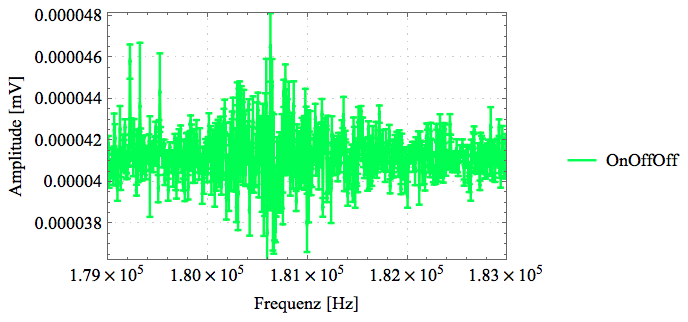
As you see I have set a certain thickness and point size for my data points. However if change the color the standard settings are used and the datapoints appear thicker:
OnOffOffPlot =
 LangPlot = ErrorListLogLinearPlot[{OnOffOff}, PlotLegends -> {"OnOffOff"},
   PlotRange -> Full, Frame -> True, FrameLabel -> {"Frequenz [Hz]", "Amplitude [mV]"},
   LabelStyle -> {FontFamily -> "Times New Roman", 12, GrayLevel[0]}, ImageSize -> Medium,
   PlotStyle -> {Green, Thickness[0.002], PointSize[0.007]}, Joined -> True, GridLines -> Automatic,
   GridLinesStyle -> Directive[Dotted, GrayLevel[0.80], Thickness[0.002]]]
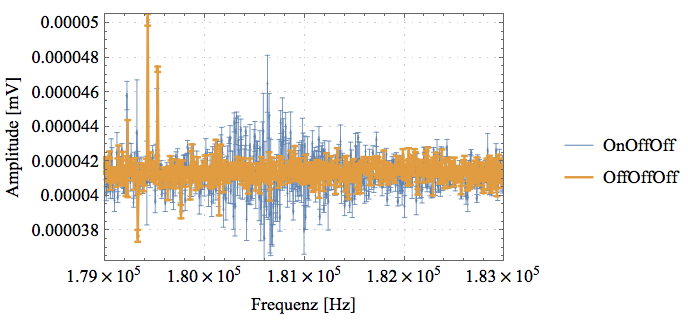
Besides if i want to plot two datasets in one diagram, only the first dataset adapts the chosen plotstyle.
OffOffOffPlot = ErrorListLogLinearPlot[{OnOffOff, OffOffOff},
  PlotLegends -> {"OnOffOff", "OffOffOff"}, PlotRange -> Full,
  Frame -> True, FrameLabel -> {"Frequenz [Hz]", "Amplitude [mV]"},
  LabelStyle -> {FontFamily -> "Times New Roman", 12, GrayLevel[0]},
  ImageSize -> Medium, PlotStyle -> {Thickness[0.002], PointSize[0.007]}, Joined -> True,
  GridLines -> Automatic, GridLinesStyle -> Directive[Dotted, GrayLevel[0.80], Thickness[0.002]]]
 Attachments:


