Yes this can be programmed. Mathematica is also good choice for a platform to program this on.
How do you learn how to do this? The answer fundamentally is that you have to learn enough about programming Mathematica.
Let's make some example data that is linear and has some normally distributed noise added to it:
exampleData = Table[{x, 2 x + RandomVariate@NormalDistribution[]}, {x, 2, 5, 0.1}]
background = ListPlot[exampleData]
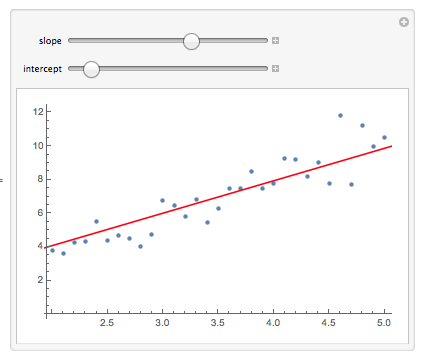
Now, we can make a function that takes a slope and intercept and plots a line with those values. Let's give it some test values and see what it looks like when we combine it with Manipulate:
plotOfLine[slope_, intercept_] := Plot[slope x + intercept, {x, 0, 6}, PlotStyle -> Red];
Show[background, plotOfLine[2, 3]]
Great. We want to make a dialog where we can adjust those values. Manipulate is a great choice for this.
Manipulate[Show[background, plotOfLine[slope, intercept]], {slope, 0.1, 3}, {intercept, 0, 3}]
You can add more features to this. It will require some programming however


