Hi,
I want only selected points to be visible on the plot.
the command line I used,
times = {0.`, 0.010564394332580655`, 0.0226080431189048`,
  0.035657342069558645`, 0.0494371605167447`, 0.06378744996062383`,
  0.07861135410179364`, 0.09384727109843208`, 0.10945398502549664`,
  0.12540251398313346`, 0.14167144392219172`, 0.15824412875997518`,
  0.17510692666518202`, 0.19224803201430066`, 0.20965666023447332`,
  0.22732244652156494`, 0.2452349758083324`, 0.2633833930344856`,
  0.2817560611347285`, 0.3003402451306919`, 0.31912180746466234`,
  0.33808490401058205`, 0.35721167305605683`, 0.3764819115780205`,
  0.3958727347219308`, 0.4153582158062164`, 0.4349090056121666`,
  0.454491931356232`, 0.47406957773782876`, 0.493599854972725`,
  0.5130355619253875`, 0.5323239565087928`, 0.5514063505787453`,
  0.5702177527226686`, 0.5886865896559408`, 0.6067345452661107`,
  0.6242765653169298`, 0.641221084710472`, 0.6574705417886914`,
  0.672922248616265`,
  0.6874696850580504`};(*list of x values*)

states = {{2.4`,
   2.9586962810219752`, 3.466396664537449`, 3.9157260729614705`,
   4.310066101396232`, 4.655691575913715`, 4.958873551058233`,
   5.225052733141882`, 5.458733929820269`, 5.663595373549623`,
   5.842639349430618`, 5.998330357252999`, 6.132708275690263`,
   6.247477229974658`, 6.344074341816468`, 6.423722787490571`,
   6.487472914750585`, 6.536234357312932`, 6.570801375964977`,
   6.5918730959194045`, 6.600069887944626`, 6.595946828516591`,
   6.580004945019932`, 6.552700784046626`, 6.514454717445955`,
   6.465658309635043`, 6.4066810017144045`, 6.337876316452996`,
   6.2595877481747815`, 6.172154469080566`, 6.07591695538528`,
   5.971222610095673`, 5.858431431781374`, 5.737921747918512`,
   5.610095995017263`, 5.475386483684541`, 5.334261033357055`,
   5.187228297880782`, 5.03484253017493`, 4.877707455123916`,
   4.716478841326693`}};(*lists of y values*)t1 =
 TemporalData[states, {times}];
Similarly for t2, t3, t4
p2 = ListLinePlot[{t1, t2, t3, t4},
  PlotLegends -> {"Kmo = 0.002 g/m2/yr", "Kmo = 0.004 g/m2/yr",
    "Kmo = 0.006 g/m2/yr", "Kmo = 0.008 g/m2/yr"},
  PlotStyle -> Reverse[colors], Frame -> True,
  LabelStyle -> {Black, Bold}, PlotMarkers -> Automatic,
  FrameLabel -> {StyleForm["ECM N Biomass g/m2", FontSize -> 13],
    StyleForm["Plant N biomass g/m2", FontSize -> 13]}]
and the resulting graph,
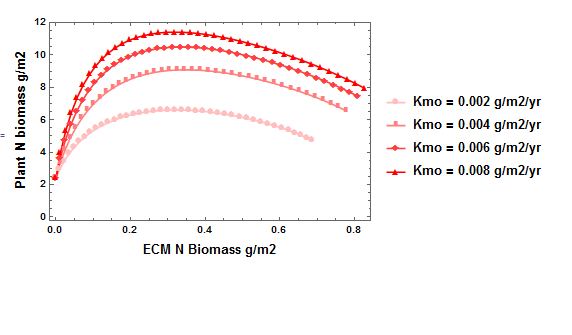
But then with Plot marker set to be automatic, all my data points are getting visible..what i want to do is for examply only show selected points , such as when time is correspoding to the bolded selection..
times = {0.`, **0.010564394332580655**`, 0.0226080431189048`,
  0.035657342069558645`, 0.0494371605167447`, 0.06378744996062383`,
  0.07861135410179364`, 0.09384727109843208`, 0.10945398502549664`,
  0.12540251398313346`, 0.14167144392219172`, 0.15824412875997518`,
  0.17510692666518202`, 0.19224803201430066`, 0.20965666023447332`,
  0.22732244652156494`, **0.2452349758083324`**, 0.2633833930344856`,
  0.2817560611347285`, 0.3003402451306919`, 0.31912180746466234`,
  0.33808490401058205`, 0.35721167305605683`, 0.3764819115780205`,
  0.3958727347219308`, 0.4153582158062164`, 0.4349090056121666`,
  0.454491931356232`, 0.47406957773782876`, **0.493599854972725`**,
  0.5130355619253875`, 0.5323239565087928`, 0.5514063505787453`,
  0.5702177527226686`, 0.5886865896559408`, 0.6067345452661107`,
  0.6242765653169298`, **0.641221084710472**`, 0.6574705417886914`,
  0.672922248616265`,
  0.6874696850580504`}


