Message Boards Message Boards

2
|
19823 Views
|
6 Replies
|
5 Total Likes
View groups...
Share
Share this post:

How to get FinancialData[] Exchange Rates ?

Anonymous User
Anonymous User
Posted 9 years ago

Hi,

I want to extract a times series of Exchange Rates between, say, EURO and USD. I enter the following command:

FinancialData[{"EUR","USD"}, {{2005,1,1},{2008,1,1}}]

Unfortunately, it does not work! and to my surprise, against my tremendous search in Mathematica to retrieve Times series exchange rates I simply cannot retrieve any time series exchange rates but only the current exchange rate. However, for stock market data, the above code works.

What is going on? Please let me receive your help.

Thanks.

POSTED BY: Anonymous User
6 Replies
Posted 7 years ago

This seems to be a yahoo finance thing. "X" is USD so for EUR/USD you need to divide by 1. For say USD/JPY you do not.

euro = TimeSeries[FinancialData["EUR=X", "Price", {{2006}, {2016}, "Week"}][[All,2]]];
eurusd = 1/euro;
ListLinePlot[eurusd]

enter image description here

ts = FinancialData["EUR=X", {{2006}, {2016}, "Week"}];
tx = TimeSeries[ts];
tsx = 1/tx;
DateListPlot[tsx]

enter image description here

POSTED BY: Kelly O

Exchange rates in Excel. I had used MarketXLS for this. It works for me great.

POSTED BY: Harrison Delfino
Posted 9 years ago

Tray downloading the info directly from the ECB site.

The ECB maintains the daily exchange rates since 1999 for the most important currencies in a single spreadsheet (Excel) [eurofxref-hist.csv], all currency pairs related. It is updated by the ECB on a daily basis.

https://www.ecb.europa.eu/stats/exchange/eurofxref/html/index.en.html

It is available in CSV and XML formats and can be easily dumped to Mathematica.

In the link about you can find it along with many other pieces of info on currencies.

Good luck.

Martin.

POSTED BY: E Martin

You also can use:

Financial data from Quandl in Wolfram Language using QuandlLink

<< QuandlLink`

AUDvsUSDrates = QuandlFinancialData["CURRFX/AUDUSD",
    startDate -> "1995-1-1", endDate -> "2015-5-1"];

DateListPlot[Transpose[{#[[All, 1]], #[[All, 2, 1]]} &@Rest[AUDvsUSDrates]], 
 PlotTheme -> "Detailed"]

enter image description here

POSTED BY: Vitaliy Kaurov

We depend on financial services that sometimes are off on their side to provide the data. What I would recommend is to use Wolfram|Alpha calls. For example in your case:

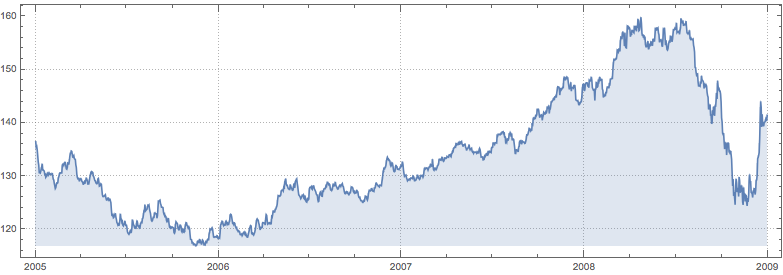
tmp = WolframAlpha["EUR vs USD from 2005 to 2008", {{"Result", 1}, "ComputableData"}];
DateListPlot[Most[tmp], PlotTheme -> "Detailed", AspectRatio -> 1/3, Filling -> Bottom]

enter image description here

Below is explanation to understand this code.

If one looks for curated data accessible from Mathematica, the WolframAlpha function should always be considered as an option, because it links to curated data bases with frequent continuous updating:

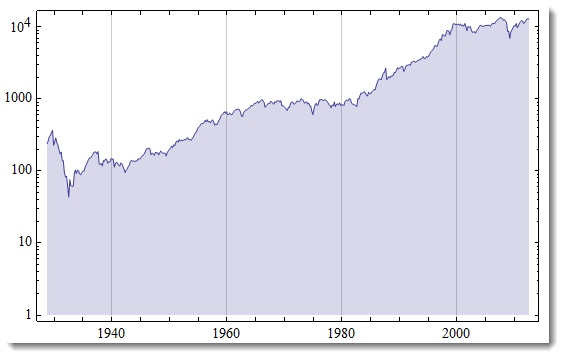
data = WolframAlpha["^DJI price history", 
         {{"HistoryDaily:Close:FinancialData", 1}, "TimeSeriesData"}, 
         PodStates -> {"HistoryDaily:Close:FinancialData__All data"}];

And this is basically the same plot as in the documentation:

DateListLogPlot[data, Filling -> 1, Joined -> True]

enter image description here

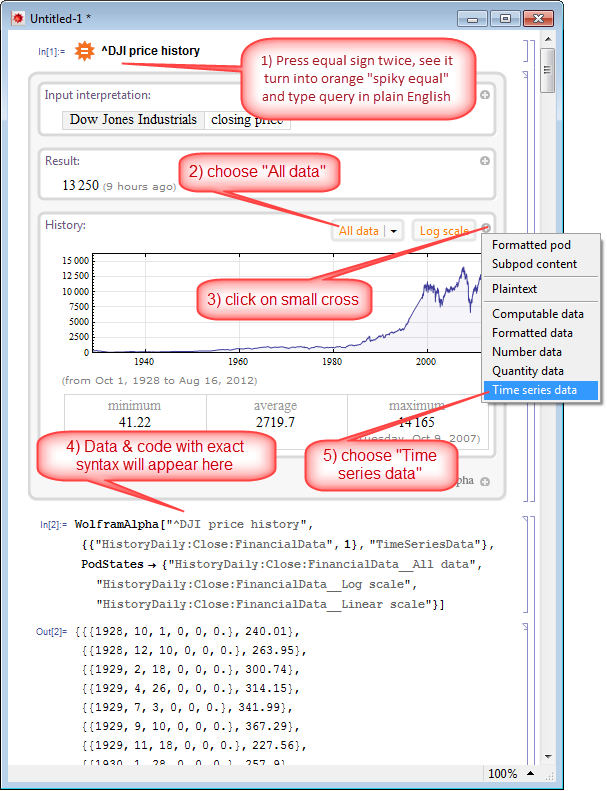
You also can access these data interactively to get the same programming syntax. This can actually teach how syntax looks in different cases:

enter image description here

To understand better WolframAlpha integration in Mathematica I suggest the following sources:

POSTED BY: Vitaliy Kaurov
Anonymous User
Anonymous User
Posted 9 years ago

Dear Vitaliy, Thanks to you that now I have the solution. However, I am still suspicious that my problem was because of the poor services of data providers. the reason is that I get the current exchange rate but cannot get times series since two days.

Temel

POSTED BY: Anonymous User
Reply to this discussion
Community posts can be styled and formatted using the Markdown syntax.
Reply Preview
Attachments
Remove
or Discard

Group Abstract Group Abstract