Clear["Global`*"]
c1 = 1087.25308032939;
c2 = 12.325741364839818;
L = 0.05;
from = 0;
range = 1;(*Range to 1 *)
ranTick = Table[n, {n, from, range,0.2}];(*A table with "n" running from 0 to 1 in steps of 0.2*)
eq[x_, Y_] := c1*x*L + 300 + (3.792138697169207*10^(-8) - 1.4574609772438382*10^(-12)*Exp[-592.2084940913409*Y] -
3.7919929510717574*10^(-8)*Exp[-296.10424704567043*Y] + (-1.0000112291152965 + 0.5016999501003022*Y)*Y)*c2;
ContourPlot[eq[x, Y], {x, 0, range}, {Y, 0, range},ContourStyle -> None, FrameLabel -> {X, "Y"}, PlotLabel -> T[X, "Y"],
BaseStyle -> {FontFamily -> "Times", FontSize -> 12},LabelStyle -> Directive[Black, FontSize -> 13],
PlotLegends -> BarLegend[Automatic, None, LegendLabel -> "T(x,y)"],FrameTicks -> {{ranTick, None}, {ranTick, None}},
ColorFunction -> "Rainbow",LabelStyle -> {FontFamily -> "Times", Bold, Black, 12},Contours -> 100, PlotRange -> Full]
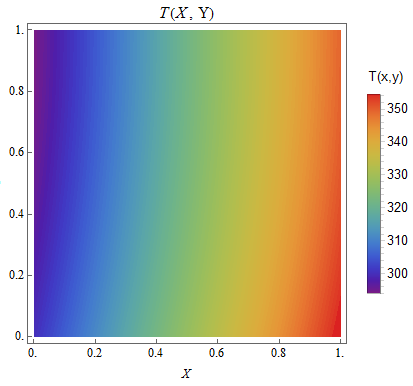
X = 0;Y = 1;X1 = 1; Y1 = 0;{eq[X, Y], eq[X1, Y1]}
{293.858, 354.363}
Minimum temperature is 293.858 a maximum is 354.363,and shows a range between 300-350.Its full range.
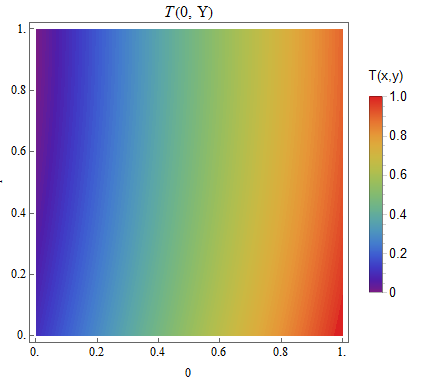
If you want to have the range from 0 to 1 in BarLegend.
PlotLegends -> BarLegend[{"Rainbow", {0, 1}}]
.
 ContourPlot[eq[x, Y], {x, 0, range}, {Y, 0, range},ContourStyle -> None, FrameLabel -> {X, "Y"}, PlotLabel -> T[X, "Y"],
 BaseStyle -> {FontFamily -> "Times", FontSize -> 12}, LabelStyle -> Directive[Black, FontSize -> 13],PlotLegends ->
 BarLegend[{"Rainbow", {0, 1}}, LegendLabel -> "T(x,y)"],FrameTicks -> {{ranTick, None}, {ranTick, None}},
 ColorFunction -> "Rainbow",LabelStyle -> {FontFamily -> "Times", Bold, Black, 12},Contours -> 100, PlotRange -> Full]