Dear Community
,
SituationI would like to develop an applet that animates intermediate steps on the tabula recta for the Vigénere cipher.
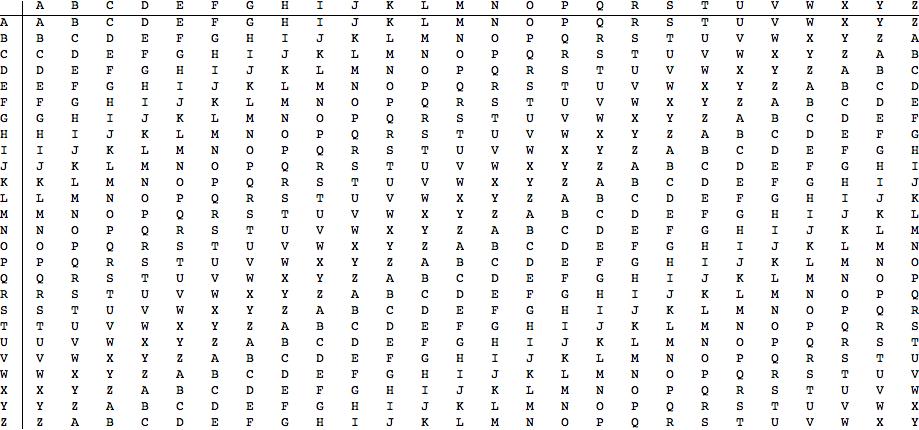
TaskThe Vigénere (and Gronsfeld) cipher is a polygraphic substitution cipher that successfully resisted attack for ~300yrs. Plaintext is enciphered through a tableau (the 'tabula recta'):
alphabet = {"A", "B", "C", "D", "E", "F", "G", "H", "I", "J", "K", "L", "M", "N", "O", "P", "Q", "R", "S", "T", "U", "V", "W", "X", "Y", "Z"};
my\[Alpha]\[Beta]Len[\[Alpha]\[Beta]Len_] := Table[RotateLeft[alphabet, i], {i, 0, \[Alpha]\[Beta]Len}];
TableForm[my\[Alpha]\[Beta]Len[Length[alphabet] - 1],
TableHeadings -> {alphabet, alphabet}]
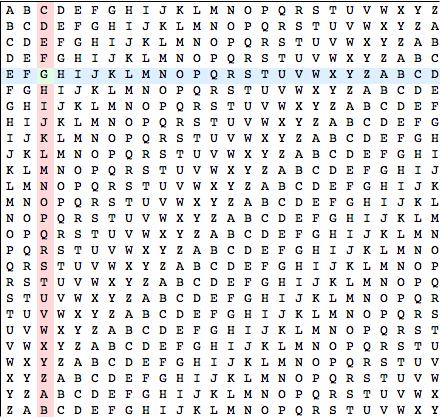
ActionI would like to highlight the row and column of the tuples generated by the Mathematica implentation of the enciphering process (truncated for clarity):
Partition[Riffle[{"A", "R", "J"}, {"M", "A", "T"}], 2]
that index the tableu elements (substitution prescription). When the table is deployed in a Matrix-formatted grid structure, the coloring rules are straightforward to implement, resulting in:
alphaMatrix = Grid[my\[Alpha]\Len[Length[alphabet] - 1],
Background -> {3 -> LightRed, 5 -> LightBlue, {5, 3} -> LightGreen},
Dividers -> {{True, False}, {True, False}}] // MatrixForm
 Result
I may be mistaken, but I believe the MatrixForm allows me to iteratitively-extract elements from the data structure. However, I lose my axis label discretion, which may obfuscate the logic behind the algorithm. I attempted to wrap a TableForm around a gridded, iterated table generation, but was unable to capture the mutually-exclusive functionality of both (that is, the indices spanning two sides and the block coloring)
alphabet = {"A", "B", "C", "D", "E", "F", "G", "H", "I", "J", "K",
"L", "M", "N", "O", "P", "Q", "R", "S", "T", "U", "V", "W", "X",
"Y", "Z"};
my\[Alpha]\[Beta]Len[\[Alpha]\[Beta]Len_] :=
Table[RotateLeft[alphabet, i], {i, 0, \[Alpha]\[Beta]Len}];
alphaMatrix =
Grid[my\[Alpha]\[Beta]Len[Length[alphabet] - 1],
Background -> {3 -> LightRed,
5 -> LightBlue, {5, 3} -> LightGreen}] // MatrixForm;
TableForm[alphaMatrix, TableHeadings -> {alphabet, alphabet}]

The resulting graph was useless (perhaps TableForm can't mutate Grid structs?) If anybody could be so kind as to help me highlight the ith row and jth column in a grid structure and extend the range of those highlights to the index components of the lookup table (static axis labels), I would be exceedingly grateful.
Warn regards,
Arjan Singh Puniani


