Message Boards Message Boards

0
|
3574 Views
|
1 Reply
|
1 Total Likes
View groups...
Share
Share this post:

Plot function with shading between bounds

Posted 10 years ago

Hello, could I please ask for help with the following problem. I have a graph of the normal distribution. I have specified point in the interval (0, 1) - Point1. May I ask, how do I mark out the area under the curve? The extreme points - Point1, Point2

Thank you for the advice :)

enter image description here

POSTED BY: martin martin

I suggest (see more solutions HERE):

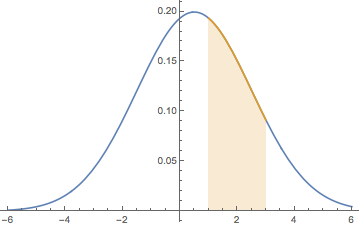
Plot[{#,Piecewise[{{#,1<=x<=3}},_]},{x,-6,6},
Filling->{2->Axis}]&@PDF[NormalDistribution[1/2,2],x]

enter image description here

POSTED BY: Vitaliy Kaurov
Reply to this discussion
Community posts can be styled and formatted using the Markdown syntax.
Reply Preview
Attachments
Remove
or Discard

Group Abstract Group Abstract