I would like to plot cones centered at specific points in a lattice and with different orientations and colors that depend on them. For this, I have the data in an external file with 11 columns: 1) the first 5th columns are not relevant. 2) column c6 has the theta spherical angle. 3) columns c7,c8 are the x and y components of my vectors. 4) columns c9,c10,c11 are the x,y,z coordinates of the lattice nodes.
To plot the cones I use the Cone[{x0,y0,z0},{xf,yf,zf},r] commmand that needs the coordinates of the start and end of the Cone[{x0,y0,z0},{xf,yf,zf},r] to be drawn. So, my idea was setting the coordinates as read from the different columns as:
x0=c9-cos(phi)sin(c6), y0=c10-sin(phi)sin(c6), z0=c11-sin(c6) xf=c9+cos(phi)sin(c6), yf=c10+sin(phi)sin(c6), zf=c11+sin(c6)
where phi=ArcTan[c7,c8]. I have used the following code to implement this. But it is obvious that it does not work. Cones are plotted where they should but neither orientation nor color are correct. Any idea on how to modify Posi and Posf so as to add or substract the proper quantities? Any idea on how to modify the Hue?
data = Import["a.dat", "Table"];
CosTh = Cos[data[[;; , 6]]];
SinTh = Sin[data[[;; , 6]]];
CosPhi = Cos[ArcTan[data[[;; , 7]], data[[;; , 8]]]];
SinPhi = Sin[ArcTan[data[[;; , 7]], data[[;; , 8]]]];
Posi = data[[;; , 9 ;; 11]] - CosPhi;
Posf = data[[;; , 9 ;; 11]] + CosPhi;
Pos2 = Transpose[{Posi, Posf}];
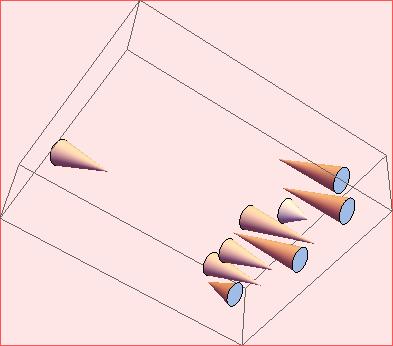
Graphics3D[{Hue[CosTh], Cone[Pos2, 0.5]}]
Sample file (a.dat):
5 1 0 0   0    0.4003 -0.28 -0.27 50.00 50.00 13.00
2 1 0 0   0    1.8608  0.82 -0.49 47.00 42.00 14.00
2 1 0 0   0    1.3921 -0.30 -0.94 48.00 42.00 14.00
2 1 0 0   0    2.1094 -0.81 -0.29 49.00 42.00 14.00
9 1 0 0   0    1.2351  0.90 -0.27 50.00 42.00 14.00
9 1 0 0   0    1.1159 -0.62 -0.65 51.00 42.00 14.00
9 1 0 0   0    0.8004 -0.53  0.48 52.00 42.00 14.00
9 1 0 0   0    1.5252  0.41 -0.91 53.00 42.00 14.00
2 1 0 0   0    1.4176  0.81  0.57 46.00 43.00 14.00