Message Boards Message Boards

Varying Thickness along curve in ParametricPlot3D

Posted 10 years ago

Here's my region:

ParametricPlot3D[{
  u^Cos[2/3 t] Cos[t],
  u^Cos[2/3 t] Sin[t],
  -(2/3) Log[u] Sin[2/3 t]
  }, {t, 0, 1  Pi}, {u, 2.5, E}, MaxRecursion -> 0, PlotPoints -> 25, 
 PlotStyle -> {{Opacity[0.5], Thickness[0.2]}}, Mesh -> False]

enter image description here

I'd like to vary the Thickness with t, so that the cross-section is the same shape (approximately square) along the entire curve, but varying in size with t. Something like: PlotStyle -> {{Opacity[0.5], Thickness[3/2 t/Pi]}}

But the error says: Ignoring invalid graphics directive Thickness....

Any ideas?

POSTED BY: Bryan Lettner
5 Replies

Yes, to have a square section everywhere you will have to replace the Rescale[t, {0, Pi}, {.2, .05}]] part, which is just linear in t, with something that is proportional to the desired section, which is nonlinear.

POSTED BY: Gianluca Gorni

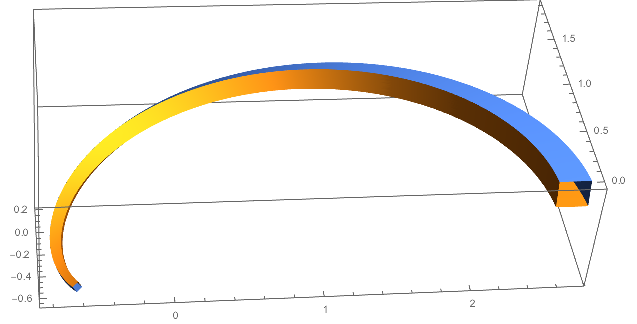
You can vary the color along a surface, but not the thickness, as far as I know. You can work around the problem by displacing a copy of the surface in the orthogonal direction, like this:

myFun[t_, u_] = {u^Cos[2/3 t] Cos[t], 
   u^Cos[2/3 t] Sin[t], -(2/3) Log[u] Sin[2/3 t]};
normalVec[t_, u_] = 
  Normalize[Cross[D[myFun[t, u], u], D[myFun[t, u], t]]] // Simplify;
myNewFun[t_, u_, z_] = myFun[t, u] + z*normalVec[t, u];
Show[ParametricPlot3D[{myNewFun[t, u, 0], 
   myNewFun[t, u, Rescale[t, {0, Pi}, {.2, .05}]]}, {t, u} \[Element] 
   Rectangle[{0, 2.5}, {Pi, E}]], 
 ParametricPlot3D[{myNewFun[t, 2.5, 
    z*Rescale[t, {0, Pi}, {.2, .05}]],
   myNewFun[t, E, z*Rescale[t, {0, Pi}, {.2, .05}]]}, {t, 
    z} \[Element] Rectangle[{0, 0}, {Pi, 1}]]]

enter image description here

POSTED BY: Gianluca Gorni
Posted 10 years ago

Thank You Gianluca! The work-around works. I had to edit the "Show" code a bit to get it to work for me, so here's a paste of what I used:

Show[ParametricPlot3D[{myNewFun[t, u, 0], 
   myNewFun[t, u, Rescale[t, {0, Pi}, {.2, .05}]]}, {t, 0, Pi}, {u, 
   2.5, E}, Mesh -> False], 
 ParametricPlot3D[{myNewFun[t, 2.5, z*Rescale[t, {0, Pi}, {.2, .05}]],
    myNewFun[t, E, z*Rescale[t, {0, Pi}, {.2, .05}]]}, {t, 0, Pi}, {z,
    0, 1}, Mesh -> False]]

enter image description here

I am going to have a lot of NewFun with this method.

POSTED BY: Bryan Lettner

A very neat idea, @Gianluca Gorni, thank you for posting !

POSTED BY: Vitaliy Kaurov
Posted 10 years ago

It is actually not a perfect workaround... I just realized it is square at each end, but more rectangular in the middle. I will post a fix if I find something. Still a cool method though.

Here's what it looks like taking t to only 0.7 Pi :

enter image description here

POSTED BY: Bryan Lettner
Reply to this discussion
Community posts can be styled and formatted using the Markdown syntax.
Reply Preview
Attachments
Remove
or Discard

Group Abstract Group Abstract