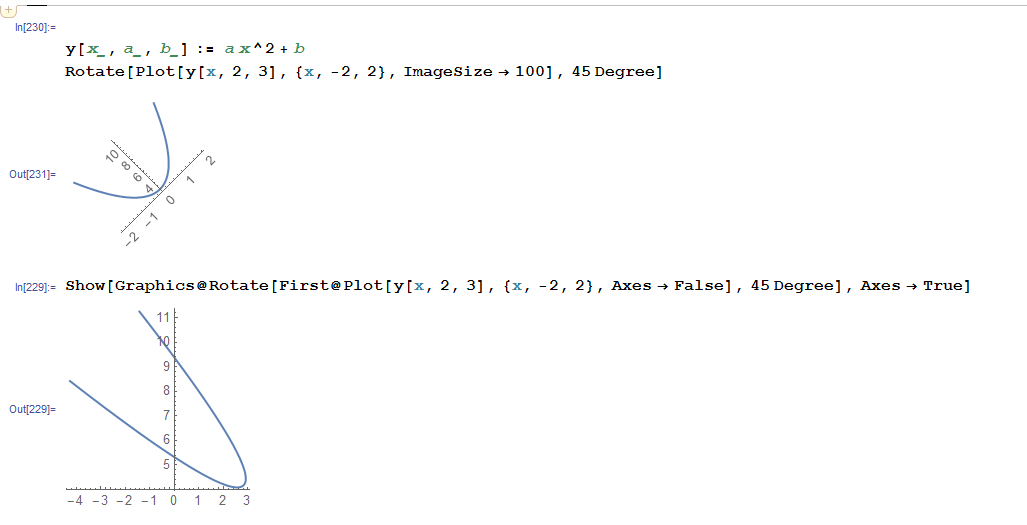
One normally rotates a coordinates frames. But you can achieve what you want like this
Replace
y[x_, a_, b_] := a x^2 + b
Rotate[Plot[y[x, 2, 3], {x, -2, 2}], 45 Degree]
with
Show[Graphics@
  Rotate[First@Plot[y[x, 2, 3], {x, -2, 2}, Axes -> False],
   45 Degree], Axes -> True]
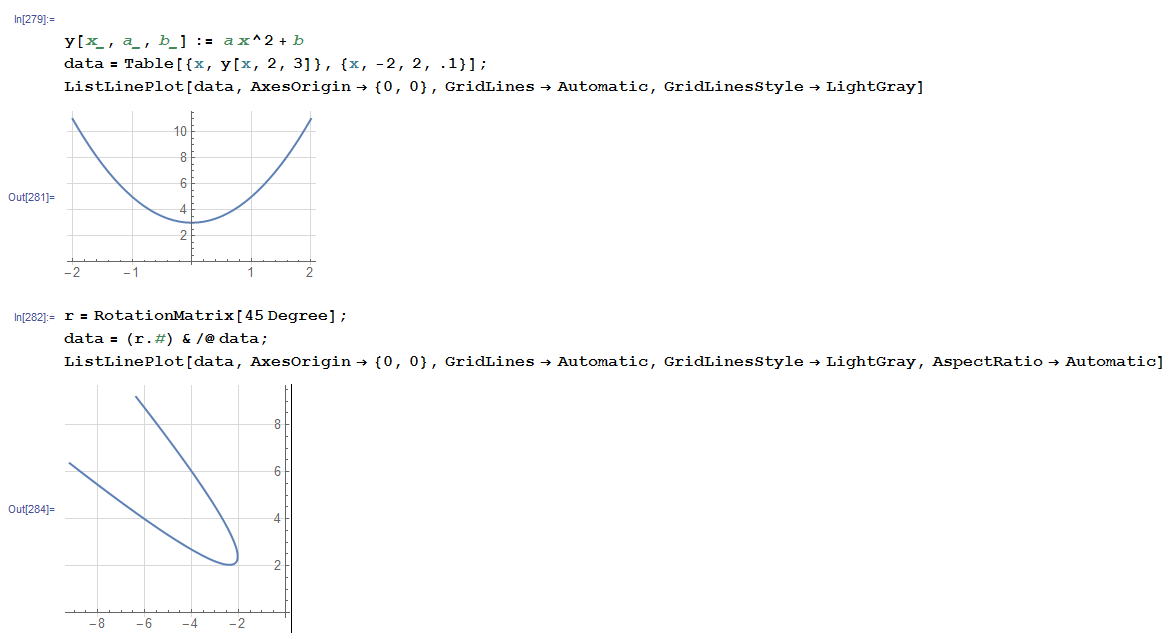
Another (better?) option is to obtain the data itself (position vector of each point) and apply a RotationMatrix to each point. Something like
y[x_, a_, b_] := a x^2 + b
data = Table[{x, y[x, 2, 3]}, {x, -2, 2, .1}];
ListLinePlot[data, AxesOrigin -> {0, 0}, GridLines -> Automatic,  GridLinesStyle -> LightGray]

r = RotationMatrix[45 Degree];
data = (r.#) & /@ data;
ListLinePlot[data, AxesOrigin -> {0, 0}, GridLines -> Automatic, GridLinesStyle -> LightGray, AspectRatio -> Automatic]