Message Boards Message Boards

0
|
9695 Views
|
2 Replies
|
2 Total Likes
View groups...
Share
Share this post:

Highlight certain data points

Posted 9 years ago

hi,

I have a question about highlighting certain data points in a plot.. and will be great if i can get some inputs on it..

For example,

x = {0, 1, **2**, 3, 4, 5, **6**, 7, 8, 9,**10**} ,
y = {{10, 9, **8**, 7, 6, 5, **4**, 3, 2, 1, **0**}};

I only want to highlight the following datapoint on a list line plot... the colour for highlighting of the data points would be more representative if it was in a fading colour intensity.. for example I marked the points using paint. Is there any function for this in Mathematica??

Thanks in advance..

enter image description here

POSTED BY: ash ash
2 Replies

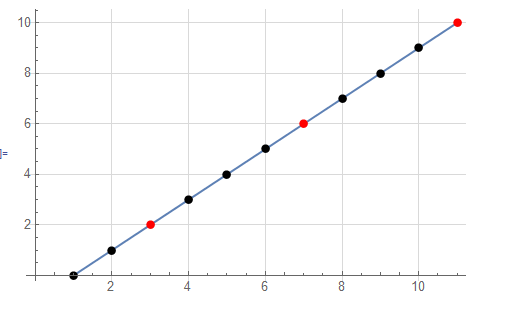
You can use Style. I made the point Red for illustration. You change that as needed.

x = {0, 1, 2, 3, 4, 5, 6, 7, 8, 9, 10};
xt = If[MemberQ[{2, 6, 10}, #], Style[#, Red], Style[#, Black]] & /@ x;
ListLinePlot[xt, Mesh -> All, GridLines -> Automatic, GridLinesStyle -> LightGray]

You write the xt line also as

xt = Style[#, If[MemberQ[{2, 6, 10}, #], Red, Black]] & /@ x;

enter image description here

POSTED BY: Nasser M. Abbasi
Posted 9 years ago

Hi,

Thanks for your response..

in this case I would only like to plot the red dots without highlighting the other black dots... and the red dots that should be on an increasing shade of intensity.. and the x and y intercepts are not the same.. may be i gave a wrong example..

so,, x ={ 1,2,3,4,5,6,7,8}

y={ 0.2 , 0.7, 0.9, 1 , 1.5 , 2, 2.3, 5}

Here i would only like to highlit these three data points.. but for example red colour where the interccetpt { 2,0.7} is light shaded and {8,5} is dark shaded... would be great to have some help..

POSTED BY: ash ash
Reply to this discussion
Community posts can be styled and formatted using the Markdown syntax.
Reply Preview
Attachments
Remove
or Discard

Group Abstract Group Abstract