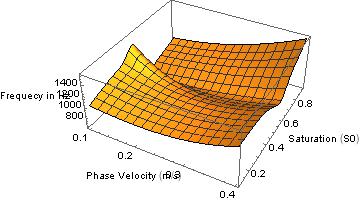
I am using the command to plot 3D graph...
Plot3D[f[x, y], {x, .1, .4}, {y, .1, .9},
 LabelStyle -> {FontFamily -> "Arial Baltic", 10, GrayLevel[0]},
 AxesLabel -> {"Phase Velocity (m/s)", "Saturation (S0)",
   "Frequency in Hz"}]
And getting the following output

The output graph are not well labeled.
Kindly suggest some alternate ways of doing this.. Thanks.