Message Boards Message Boards

0
|
5081 Views
|
1 Reply
|
1 Total Likes
View groups...
Share
Share this post:

Labeling in ListPlot 3D

Posted 9 years ago

I am using the command to plot 3D graph...

Plot3D[f[x, y], {x, .1, .4}, {y, .1, .9}, 
 LabelStyle -> {FontFamily -> "Arial Baltic", 10, GrayLevel[0]}, 
 AxesLabel -> {"Phase Velocity (m/s)", "Saturation (S0)", 
   "Frequency in Hz"}]

And getting the following output
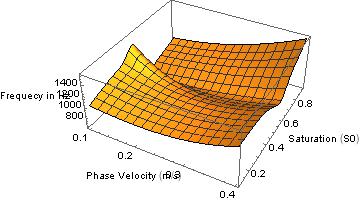
enter image description here

The output graph are not well labeled.

Kindly suggest some alternate ways of doing this.. Thanks.

POSTED BY: abhishek sharma

One simple way is to wrap each Axes label in a Pane and give it a good FrameMargine. Example

fm = 20; (*adjust as needed*)
Plot3D[Sin[x + y^2], {x, -3, 3}, {y, -2, 2},
 AxesLabel -> {Pane["Phase Velocity (m/s)", FrameMargins -> fm], 
 Pane["Saturation (S0)", FrameMargins -> fm], 
 Pane["Frequecy in Hz", FrameMargins -> fm]}, 
 ImageSize -> 400]

enter image description here

POSTED BY: Nasser M. Abbasi
Reply to this discussion
Community posts can be styled and formatted using the Markdown syntax.
Reply Preview
Attachments
Remove
or Discard

Group Abstract Group Abstract