One simple way is to wrap each Axes label in a Pane and give it a good FrameMargine. Example
fm = 20; (*adjust as needed*)
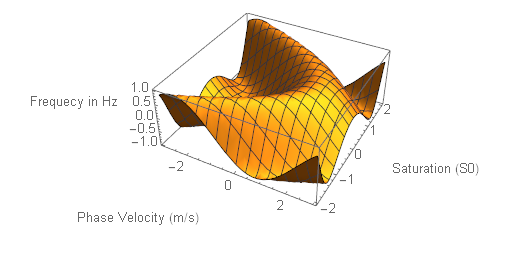
Plot3D[Sin[x + y^2], {x, -3, 3}, {y, -2, 2},
AxesLabel -> {Pane["Phase Velocity (m/s)", FrameMargins -> fm],
Pane["Saturation (S0)", FrameMargins -> fm],
Pane["Frequecy in Hz", FrameMargins -> fm]},
ImageSize -> 400]