Group Abstract Group Abstract

Message Boards Message Boards

0
|
7.8K Views
|
5 Replies
|
2 Total Likes
View groups...
Share
Share this post:

How to interpolate different datasets for math operations combining them ?

Posted 10 years ago

Suppose I have two datasets (A & B) in separate two-column ASCII files, the first column designating "x", the second "y" values. I can import them, modify them and plot them together, no problem. Now I'd wish to calculate e.g. a linear combination of their "y" values ( a*Ay + b* By), but their "x"-values differ (while having a common range, of course), and both could be given on non-regularly spaced "x"-grids. Now I would guess that in order to do this I will first have to either - interpolate one dataset to the "x"-values of the other - interpolate both to a third (regularly spaced ?) grid spanning the common range.

I have read through the help pages of Interpolate[] and ListInterpolate[] but couldn't quite figure out what to do. I'd much appreciate some help!

Or is there a command which does the appropriate interpolation automatically? Many thanks for your input.

POSTED BY: Kai Fauth
5 Replies
Posted 10 years ago

Interesting suggestion, thank you. Indeed, the real datasets have hundrets of datapoints and things get slow as they become more complex. Before that "linear combination" occurs (a subtraction, actually), there are several convolutions being applied to "model data" to get them in correspondence with "experimental data".

Are there other advantages to having datasets be defined as time series? And is this "simple interpolation scheme" specific to this definition?

Edit: and btw, among the adaptions I have to do there is also a shift on the abscissa. Would that require to redo the TimeSeries statement? At present, I simply use ListPlot[{xval+shift,yval}] in a modify[... {{shift, start},min,max}] type of environment.

POSTED BY: Kai Fauth

I think one should not use Interpolate and reevaluate, there is a much easier way:

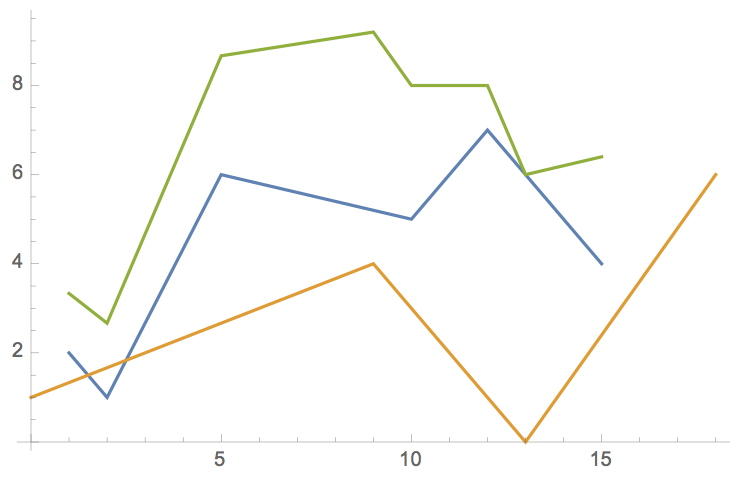
v = {2, 1, 6, 5, 7, 4};
t = {1, 2, 5, 10, 12, 15};
ts = TimeSeries[v, {t}]

v2 = {1, 2, 4, 0, 6};
t2 = {0, 3, 9, 13, 18};
ts2 = TimeSeries[v2, {t2}]

ts3 = ts + ts2
ListLinePlot[{ts, ts2, ts3}]

enter code here

By default is it linear interpolation, it can be changed by giving the ResamplingMethod -> {"Interpolation", InterpolationOrder -> 0} options to TimeSeries.

POSTED BY: Sander Huisman
Posted 10 years ago

Dear Wojciech Artichowicz,

thank you very much. your code example showed me the way. To be sure it works on data imported from ASCII files here is what I amended to your code:

Export[NotebookDirectory[] <> "dataA.dat", Transpose[{Ax, Ay}]];
Export[NotebookDirectory[] <> "dataB.dat", Transpose[{Bx, By}]];
Aimp = Import[NotebookDirectory[] <> "dataA.dat"];
Bimp = Import[NotebookDirectory[] <> "dataB.dat"];
Aimpx = Aimp\[Transpose][[1]];
Aimpy = Aimp\[Transpose][[2]];
Bimpx = Bimp\[Transpose][[1]];
Bimpy = Bimp\[Transpose][[2]];
ListPlot[{Transpose[{Aimpx, Aimpy}], Transpose[{Bimpx, Bimpy}]}]
fAimp = Interpolation[Transpose[{Aimpx, Aimpy}]];
fBimp = Interpolation[Transpose[{Bimpx, Bimpy}]];
Ximp = Sort@Join[Aimpx, Bimpx];
ai = 1.0;
bi = -1.0;
fABi = ai fAimp[Ximp] + bi fBimp[Ximp];
ListPlot[Transpose[{Ximp, fABi}]]
Attachments:
POSTED BY: Kai Fauth
Posted 10 years ago

Dear Wojciech Artichowicz,

thanks for your input. This looks most useful to me. I'll give it a try later today - right now I have a lengthy calculation running...

POSTED BY: Kai Fauth

Dear Kai Fauth,

If I understood your problem well it is enough to interpolate both functions separately, and then create a comon x-values vector for them to use it for computations of their linear combination. Below I paste the code which should help you to solve your problem:

(*creating some data*)
Ax = RandomReal[{0, 9}, {10}];
Ay = Ax^2 + 1;
Bx = RandomReal[{0, 11}, {10}];
By = Bx^2 + 1.25

ListPlot[{Transpose[{Ax, Ay}], Transpose[{Bx, By}]}]
fA = Interpolation[Transpose[{Ax, Ay}]];
fB = Interpolation[Transpose[{Bx, By}]];
X = Sort@Join[Ax,Bx]; (*or X=Range[put something here];*)
a = 0.1;
b = 0.25;
fAB = a fA[X] + b fB[X];
ListPlot[fAB]
Attachments:
Reply to this discussion
Community posts can be styled and formatted using the Markdown syntax.
Reply Preview
Attachments
Remove
or Discard