In[1]:= data = {{2.6, 2.6, 120, -170.7255}, {2.6, 2.6,
    110, -170.7338}, {2.6, 2.6, 100, -170.7432}, {2.6, 2.6,
    90, -170.7547}, {2.6, 2.6, 85, -170.7612}, {2.6, 2.6,
    70, -170.7910}, {2.6, 2.6, 60, -170.7931}, {2.6, 2.6,
    50, -170.7682}, {2.6, 2.6, 40, -170.4559}, {2.6, 2.6,
    30, -168.3291}, {2.4, 2.4, 120, -170.7255}, {2.4, 2.4,
    110, -170.7338}, {2.4, 2.4, 100, -170.7432}, {2.4, 2.4,
    90, -170.7547}, {2.4, 2.4, 85, -170.7612}, {2.4, 2.4,
    70, -170.7910}, {2.4, 2.4, 60, -170.7931}, {2.4, 2.4,
    50, -170.7682}, {2.4, 2.4, 40, -170.4559}, {2.4, 2.4,
    30, -168.3291}};

In[2]:= fit[x_, y_, z_] =
 Fit[data, {1, x, x^2, y, y^2, z, z^2, x y, y z, z x}, {x, y, z}]

Out[2]= -116.822 - 19.94 x + 2.65866 x^2 - 19.94 y + 2.65866 x y +
 2.65866 y^2 - 0.102906 z - 1.50851*10^-15 x z - 1.50851*10^-15 y z +
 0.000593404 z^2

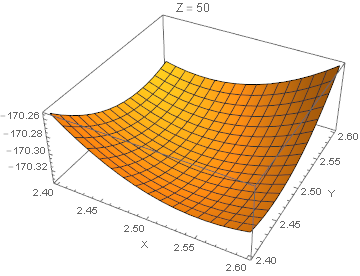
In[3]:= Plot3D[fit[x, y, 50], {x, 2.4, 2.6}, {y, 2.4, 2.6},
 PlotLabel -> "Z = " <> ToString[50], AxesLabel -> {"X", "    Y", ""}]

In[4]:= Table[f[x, y, 50], {y, 2.4, 2.6, .1}] // Evaluate

Out[4]= {f[x, 2.4, 50], f[x, 2.5, 50], f[x, 2.6, 50]}

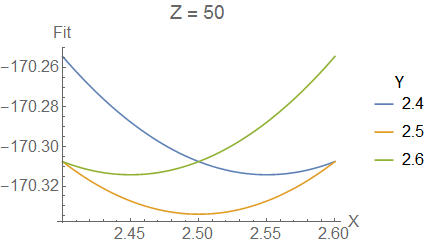
In[5]:= Plot[
 Table[fit[x, y, 50], {y, 2.4, 2.6, .1}] // Evaluate, {x, 2.4, 2.6},
 PlotLegends -> LineLegend[Range[2.4, 2.6, .1], LegendLabel -> "Y"],
 PlotLabel -> "Z = 50", AxesLabel -> {"X", "Fit"}, LabelStyle -> 16]

 Attachments: