Group Abstract Group Abstract

Message Boards Message Boards

0
|
9.6K Views
|
8 Replies
|
0 Total Likes
View groups...
Share
Share this post:

Fitting data that goes beyond a single line in Trial Version

Posted 11 years ago

Dear All, Can someone please help me in fitting the following the data in trial version of Mathematica 10? {

 2.6,2.6,120,-170.7255},
{ 2.6,2.6,110,-170.7338},
{ 2.6,2.6,100,-170.7432},
{ 2.6,2.6,90,-170.7547},
{ 2.6,2.6,85,-170.7612},
{ 2.6,2.6,70,-170.7910},
{ 2.6,2.6,60,-170.7931},
{ 2.6,2.6,50,-170.7682},
{ 2.6,2.6,40,-170.4559},
{ 2.6,2.6,30,-168.3291},
{ 2.4,2.4,120,-170.7255},
{ 2.4,2.4,110,-170.7338},
{ 2.4,2.4,100,-170.7432},
{ 2.4,2.4,90,-170.7547},
{ 2.4,2.4,85,-170.7612},
{ 2.4,2.4,70,-170.7910},
{ 2.4,2.4,60,-170.7931},
{ 2.4,2.4,50,-170.7682},
{ 2.4,2.4,40,-170.4559},
{ 2.4,2.4,30,-168.3291}

I already have the form of the fitting functions. Fitting data which can be contained in a single line of notebook does not come out with any error. Putting \ at the end of line also did not give any success. Where am I going wrong? Any comment(s) would be of great help. Thanks in advance.

POSTED BY: Himadri De
8 Replies
Posted 11 years ago

Thanks a Million !!!

POSTED BY: Himadri De
Posted 11 years ago
In[1]:= data = {{2.6, 2.6, 120, -170.7255}, {2.6, 2.6, 
    110, -170.7338}, {2.6, 2.6, 100, -170.7432}, {2.6, 2.6, 
    90, -170.7547}, {2.6, 2.6, 85, -170.7612}, {2.6, 2.6, 
    70, -170.7910}, {2.6, 2.6, 60, -170.7931}, {2.6, 2.6, 
    50, -170.7682}, {2.6, 2.6, 40, -170.4559}, {2.6, 2.6, 
    30, -168.3291}, {2.4, 2.4, 120, -170.7255}, {2.4, 2.4, 
    110, -170.7338}, {2.4, 2.4, 100, -170.7432}, {2.4, 2.4, 
    90, -170.7547}, {2.4, 2.4, 85, -170.7612}, {2.4, 2.4, 
    70, -170.7910}, {2.4, 2.4, 60, -170.7931}, {2.4, 2.4, 
    50, -170.7682}, {2.4, 2.4, 40, -170.4559}, {2.4, 2.4, 
    30, -168.3291}};

In[2]:= fit[x_, y_, z_] = 
 Fit[data, {1, x, x^2, y, y^2, z, z^2, x y, y z, z x}, {x, y, z}]

Out[2]= -116.822 - 19.94 x + 2.65866 x^2 - 19.94 y + 2.65866 x y + 
 2.65866 y^2 - 0.102906 z - 1.50851*10^-15 x z - 1.50851*10^-15 y z + 
 0.000593404 z^2

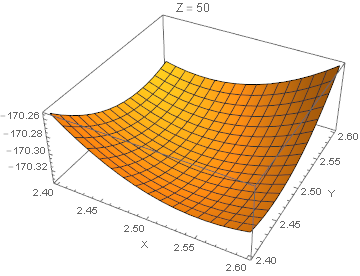
In[3]:= Plot3D[fit[x, y, 50], {x, 2.4, 2.6}, {y, 2.4, 2.6}, 
 PlotLabel -> "Z = " <> ToString[50], AxesLabel -> {"X", "    Y", ""}]

enter image description here

In[4]:= Table[f[x, y, 50], {y, 2.4, 2.6, .1}] // Evaluate

Out[4]= {f[x, 2.4, 50], f[x, 2.5, 50], f[x, 2.6, 50]}
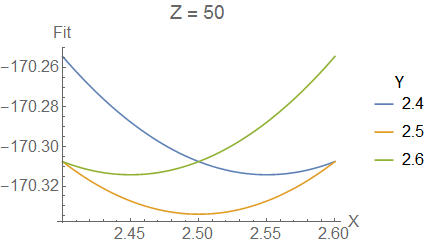
In[5]:= Plot[
 Table[fit[x, y, 50], {y, 2.4, 2.6, .1}] // Evaluate, {x, 2.4, 2.6}, 
 PlotLegends -> LineLegend[Range[2.4, 2.6, .1], LegendLabel -> "Y"], 
 PlotLabel -> "Z = 50", AxesLabel -> {"X", "Fit"}, LabelStyle -> 16]

enter image description here

Attachments:
POSTED BY: David Keith

The answer was in the 3D+2D graph.

POSTED BY: Simon Cadrin

Please attach your notebook to a post here. Otherwise we can't figure out what you are trying to do.

POSTED BY: Sander Huisman
Posted 11 years ago

Thanks. But the same worked perfectly when the data set was limited to four rows, which apparently is limited to a single line in the notebook. However, I will put the space in future to denote x*y is a single variable in Mathematica. The problem still persists for my entire set of data. Any comments will be of much help.

POSTED BY: Himadri De
Posted 11 years ago

Remember that xy is a single variable. You need to put a space in between the x and the y in order to indicate that it is a multiplication of two variables. Same for yz and zx.

POSTED BY: Gustavo Delfino
Posted 11 years ago
POSTED BY: Himadri De
POSTED BY: Sander Huisman
Reply to this discussion
Community posts can be styled and formatted using the Markdown syntax.
Reply Preview
Attachments
Remove
or Discard