Dear Mikel,
the result is actually not a plane. What happens it that the third coordinate is 5-6 orders of magnitude smaller than the other two components. This is why, when you plot it, It can be mistaken for a plane.
If you use
Graphics3D[{BSplineCurve[points]}, BoxRatios -> {1, 1, 1}, ImageSize -> Medium]
you see what is going on.
You can then also use your function
Graphics3D[{BSplineCurve[points], Green, Line[points], Red, Point[points]}, BoxRatios -> {1, 1, 1}, ImageSize -> Medium]
to achieve the same effect.
The Length might then be:
ArcLength@DiscretizeGraphics@BSplineCurve[points]
 (*165671.*)
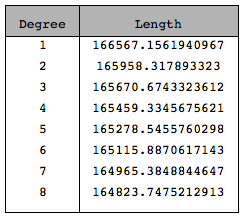
The length will, of course depend on the degree of the spline. Here is a little table to show that:
Insert[Grid[Join[{{"Degree", "Length"}}, Table[{deg, NumberForm[
      ArcLength@DiscretizeGraphics[BSplineCurve[points, SplineDegree -> deg]], 16]}, {deg, 1, 8}]]],
      {Background -> {None, {GrayLevel[0.7], {White}}}, Dividers -> {Black, {2 -> Black}}, Frame -> True, Spacings -> {2, {2, {0.7}, 2}}}, 2]
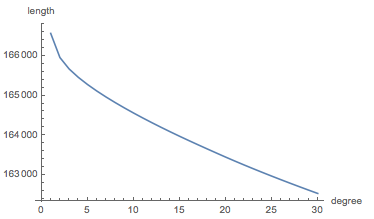
Here's a little plot of that:
ListLinePlot[
 Table[{deg, ArcLength@DiscretizeGraphics[BSplineCurve[points, SplineDegree -> deg]]}, {deg, 1, 30}], AxesLabel -> {"degree", "length"}]
Cheers,
Marco


