Message Boards Message Boards

0
|
11294 Views
|
3 Replies
|
0 Total Likes
View groups...
Share
Share this post:

How can I plot a complex vector?

Posted 9 years ago

Good morning, I need to plot the complex vector (giving the polar coordinates) in the Gauss Plane with Wolfram Alpha. How can I do this?

3 Replies

Hi Alessandro,

you could use Graphics to visualise your complex vector. In the following I refer to this picture:
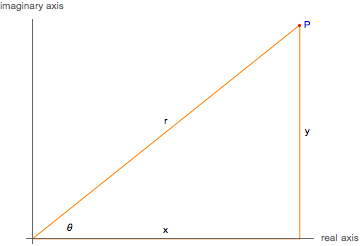
 Visualisation of the problem

  1. x = r*Cos[\[Theta]],
  2. y = r*Sin[\[Theta]].
  3. P=x+I*y, where I represents the imaginary unit

First we define a function which gives us a an arrow from the origin to the Point P:

ComplexVector[r_, \[Theta]_] := 
 Arrow[{{0, 0}, {r*Cos[\[Theta]], r*Sin[\[Theta]]}}]

If you would like to plot a straight line instead of an arrow, just exchange Arrow by Line!

Visualisation:

Graphics[{Blue, ComplexVector[1, Pi/4]}, Axes -> True, 
 AxesLabel -> {"real axis", "imaginary axis"}]

Where I choose the absolute value of our complex vector to be 1 and the angle to be 45º.

POSTED BY: Philipp Krönert

Hi Philipp, Thank you for your reply! But where I have to put into the function? If I put it in the Wolfram Alpha app on my iPad, it doesn't work.

The code above is for for the use in Mathematica. If you use the Wolfram Alpha app or the Wolfram Alpha website you just can type in (for example):

1+I*2

where x=1, y=2. Beside other information a plot is provided.

You can use the relations for x and y to convert between cartesian and polar coordinates.This link will open an example, done with the Wolfram Alpha website.

Cheers,

Philipp

POSTED BY: Philipp Krönert
Reply to this discussion
Community posts can be styled and formatted using the Markdown syntax.
Reply Preview
Attachments
Remove
or Discard

Group Abstract Group Abstract