Message Boards Message Boards

0
|
11297 Views
|
3 Replies
|
0 Total Likes
View groups...
Share
Share this post:

How can I plot a complex vector?

Posted 9 years ago

Good morning, I need to plot the complex vector (giving the polar coordinates) in the Gauss Plane with Wolfram Alpha. How can I do this?

3 Replies

The code above is for for the use in Mathematica. If you use the Wolfram Alpha app or the Wolfram Alpha website you just can type in (for example):

1+I*2

where x=1, y=2. Beside other information a plot is provided.

You can use the relations for x and y to convert between cartesian and polar coordinates.This link will open an example, done with the Wolfram Alpha website.

Cheers,

Philipp

POSTED BY: Philipp Krönert

Hi Philipp, Thank you for your reply! But where I have to put into the function? If I put it in the Wolfram Alpha app on my iPad, it doesn't work.

Hi Alessandro,

you could use Graphics to visualise your complex vector. In the following I refer to this picture: Visualisation of the problem
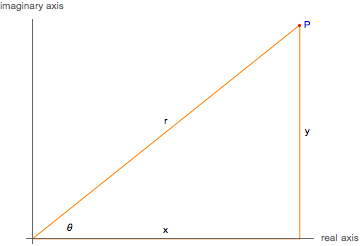
  1. x = r*Cos[\[Theta]],
  2. y = r*Sin[\[Theta]].
  3. P=x+I*y, where I represents the imaginary unit

First we define a function which gives us a an arrow from the origin to the Point P:

ComplexVector[r_, \[Theta]_] := 
 Arrow[{{0, 0}, {r*Cos[\[Theta]], r*Sin[\[Theta]]}}]

If you would like to plot a straight line instead of an arrow, just exchange Arrow by Line!

Visualisation:

Graphics[{Blue, ComplexVector[1, Pi/4]}, Axes -> True, 
 AxesLabel -> {"real axis", "imaginary axis"}]

Where I choose the absolute value of our complex vector to be 1 and the angle to be 45º.

POSTED BY: Philipp Krönert
Reply to this discussion
Community posts can be styled and formatted using the Markdown syntax.
Reply Preview
Attachments
Remove
or Discard

Group Abstract Group Abstract