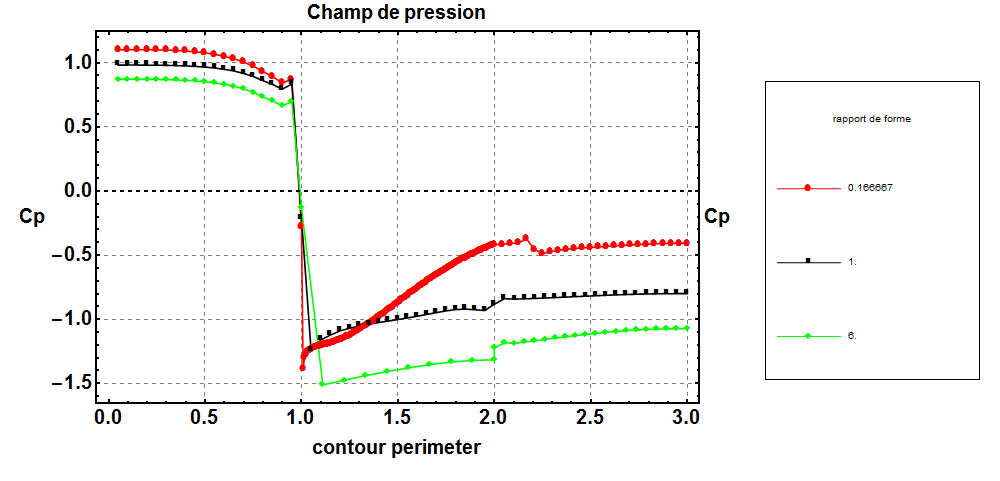
Hi, I have to plot some values. I created a nice graphic, but I don't understand how to change the size and the style of the legend label.

This is my command line:
pp = ListLinePlot [result, PlotStyle->{Red, Black, Green, Orange, Magenta,Blue},Frame->{{True,True},{True,True}}, FrameLabel->{{ Cp,Cp },{contour perimeter, Champ de pression}}, ImageSize->1000, RotateLabel -> False, Axes ->True,AxesStyle->Directive[Black, Thick,Dashed],FrameStyle->Directive[Black,Thick,Bold, FontSize->20],
GridLines ->{{0.5,1,1.5,2,2.5,3,3.5,4},Automatic}, GridLinesStyle -> Directive[Gray, Dashed],
PlotLegend-> rapp, LegendPosition->{1,-0.4},PlotMarkers-> {Automatic,10},LegendShadow->False,
LegendLabel->"rapport de forme"]
rapp is a vector with the names of the datas
I tried with this at the and of my command line: LabelStyle->{50,Bold,GrayLevel[0.3]} But it doesn't run.
Thanks for your help
Margherita