Group Abstract Group Abstract

Message Boards Message Boards

0
|
7.4K Views
|
3 Replies
|
2 Total Likes
View groups...
Share
Share this post:

Style Label in Plot legend

Hi, I have to plot some values. I created a nice graphic, but I don't understand how to change the size and the style of the legend label.

enter image description here

This is my command line:

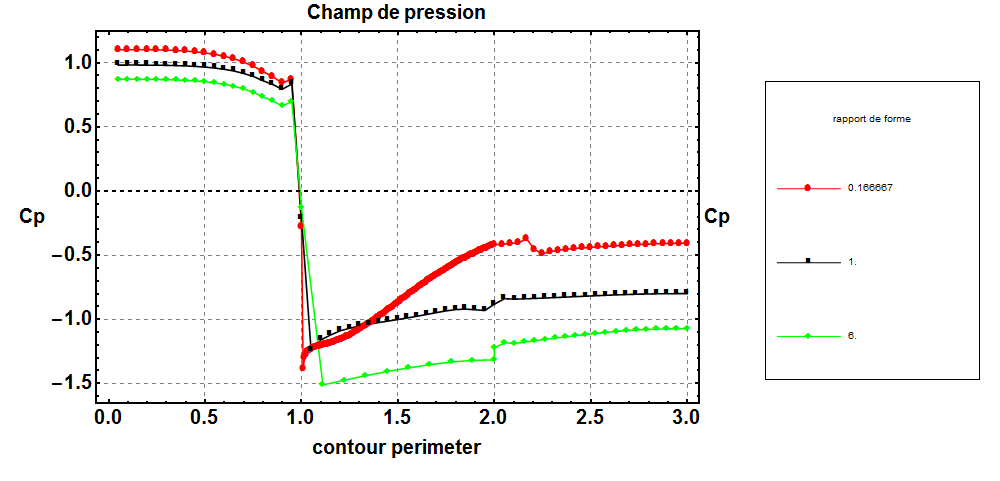
pp = ListLinePlot [result, PlotStyle->{Red, Black, Green, Orange, Magenta,Blue},Frame->{{True,True},{True,True}}, FrameLabel->{{ Cp,Cp },{contour perimeter, Champ de pression}}, ImageSize->1000, RotateLabel -> False, Axes ->True,AxesStyle->Directive[Black, Thick,Dashed],FrameStyle->Directive[Black,Thick,Bold, FontSize->20], 
GridLines ->{{0.5,1,1.5,2,2.5,3,3.5,4},Automatic}, GridLinesStyle -> Directive[Gray, Dashed],
PlotLegend-> rapp, LegendPosition->{1,-0.4},PlotMarkers-> {Automatic,10},LegendShadow->False,
LegendLabel->"rapport de forme"]

rapp is a vector with the names of the datas

I tried with this at the and of my command line: LabelStyle->{50,Bold,GrayLevel[0.3]} But it doesn't run.

Thanks for your help

Margherita

3 Replies

Thanks a lot!

very useful suggestions.

Cheers

Hi Margherite,

I missing your data and can't test your code, but probable this will help.

data1 = {10, 18, 30, 41, 50};
data2 = {30, 45, 55, 57, 60};
ListPlot[{data1, data2}
 , AxesOrigin -> {0, 0}
 , PlotRange -> All
 , Joined -> True
 , Mesh -> All
 , AxesLabel -> {"time", "y"}
 , PlotLabel -> "y(t)"
 , Filling -> {1 -> {2}}
 , PlotLegends -> PointLegend[Automatic, {"data1", "data2"}
   , LegendFunction -> "Frame"
   , LegendMarkerSize -> 20
   , LegendLabel -> "datasets"]
 ]

Good luck,....Jos

POSTED BY: Jos Klaps
Posted 10 years ago

Margherita,

If you need a custom legend, beyond just the basic options provided in most plot functions, then you probably need to use Legended:

Legended[ListLinePlot[{RandomReal[{0, 100}, 20], RandomReal[{0, 100}, 20]}], LineLegend[{Red, Blue}, {"A", "B"}, LegendLabel -> Style["legend label", Blue, FontFamily -> "Times New Roman"]]]

Legended can also be used for specific elements inside the plot. You may need to specify the plot colors so that the legend aligns with the plot, because I'm not aware of a way that Legended can pick those colors up automatically (but it's certainly possible that there is a way to do that).

POSTED BY: Eric Rimbey
Reply to this discussion
Community posts can be styled and formatted using the Markdown syntax.
Reply Preview
Attachments
Remove
or Discard