Hi Lynn,
it depends a bit on what you are plotting. If you use Plot then, as expected both functions give standard "vertical" parabolas. When you try to plot x=y^2 like that that would just be renaming the variables. If however you use ContourPlot
ContourPlot[{y == x^2, x == y^2}, {x, -2, 2}, {y, -2, 2}]
you get
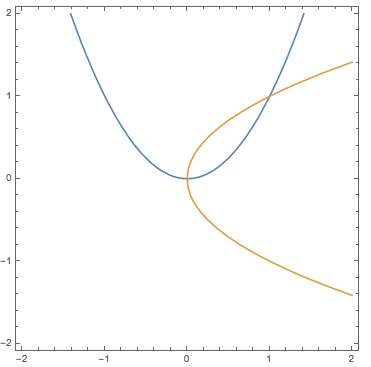
which appears to be what you want. ContourPlot, if used like this, plots the sets of points for which the equations hold. Note that the yellow/gold curve does not represent a function because for all
$x>0$ it gives two solutions.
Best wishes,
Marco


