Group Abstract Group Abstract

Message Boards Message Boards

Create interactive graph to visualize math theorems?

Posted 10 years ago
POSTED BY: Franco Lorenzo
4 Replies
Posted 10 years ago

Hello Patrick!

Thanks for your detailed answer. Eller borde jag kanske säga "Tack så mycket" (jag bor i Sverige...).

I think I'd be better off using using a specialized network visualization application such as Gephi and/or Cytoscape. They're open source applications, as you probably know, and among the best ones.

But I must say that Mathematica is AWESOME (I started learning it a couple of months ago), but of course there's no application capable of doing everything and anything ;-).

Thanks again!

Franco

POSTED BY: Franco Lorenzo
Posted 10 years ago

Hello!

Thanks for your prompt answer and sorry for the capital letters. This was my first time post...

I need to know whether you can link the edges to specific points in an external file, not just open it.

Regards, Franco

POSTED BY: Franco Lorenzo
POSTED BY: Patrik Ekenberg

Please do NOT use all capital letters in post title, - other posts are not less important than yours. Make it a habit to read docs and show some of your own effort and code to solve the problem, even if it does not work. Also please try to limit one post to one question.

Simplest way is to define theorems in the notebook:

th1 = "Theorem 1
  ---------------
  Some text
  Some text";

th2 = "Theorem 2
  ---------------
  Some text
  Some text";

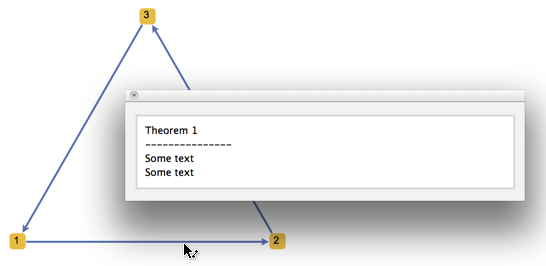
Then if you click on the edge:

Graph[{
  PopupWindow[1 -> 2, th1],
  PopupWindow[2 -> 3, th2],
  3 -> 1},
 GraphStyle -> "SmallNetwork",
 DirectedEdges -> True]

a popup window will appear:

enter image description here

To open an external file use Button instead of PopupWindow and put SystemOpen inside it.

POSTED BY: Vitaliy Kaurov
Reply to this discussion
Community posts can be styled and formatted using the Markdown syntax.
Reply Preview
Attachments
Remove
or Discard