How would I find the least squares regression line for the 4 given (x,y) points {{-3, 0}, {-1, 1}, {0, 2}, {2, 3}}? I am trying to use the LeastSquares command, but not having much success understanding the documentation and thus getting the command to work properly.
Thanks,
Mitch Sandlin
Or this:
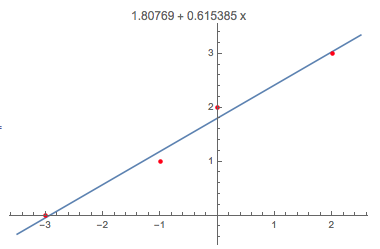
data = {{-3, 0}, {-1, 1}, {0, 2}, {2, 3}};
line = Fit[data, {1, x}, x];
Show[Plot[line, {x, -3.5, 2.5}], ListPlot[data, PlotStyle -> Red], PlotLabel -> ToString[line]]
Cheers,
M.
You should use LinearModelFit rather than LeastSquares given that you have the data points rather than the structure m.x == b as described in the documentation.
LinearModelFit
LeastSquares
m.x == b