Group Abstract Group Abstract

Message Boards Message Boards

0
|
7.9K Views
|
2 Replies
|
2 Total Likes
View groups...
Share
Share this post:

Coloring a parametric plot according to the independent variable?

I would like to color my parametric plot according to the independent variable (let's say time) and show the change in a bar legend. How do I do that?

2 Replies

As Sander points out, there are many varieties of ParametricPlot, 2D or 3D, one variable or two, but here is just an idea of how you could build a ColorFunction to to suit your needs:

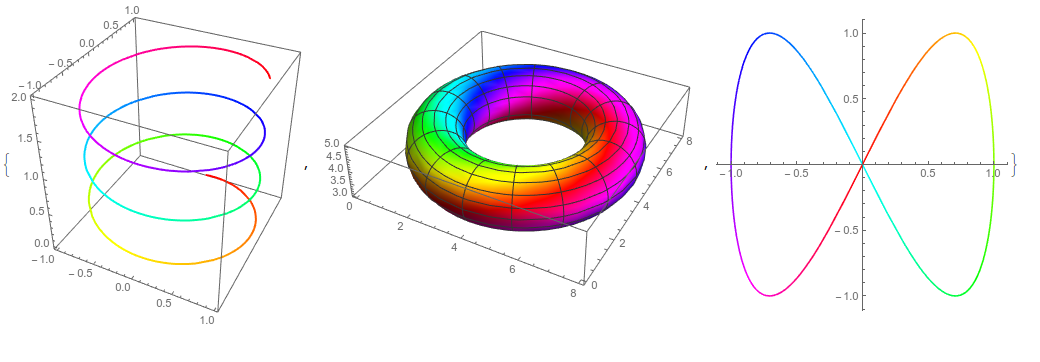
{ParametricPlot3D[{Sin[u], Cos[u], u/10}, {u, 0, 20}, 
  ColorFunction -> Function[{x, y, z, u}, Hue[u]]],
 ParametricPlot3D[{4 + (3 + Cos[v]) Sin[u], 4 + (3 + Cos[v]) Cos[u], 
   4 + Sin[v]}, {u, 0, 2 \[Pi]}, {v, -\[Pi], \[Pi]}, 
  ColorFunction -> Function[{x, y, z, u, v}, Hue[u + v]]],
 ParametricPlot[{Sin[u], Sin[2 u]}, {u, 0, 2 Pi}, 
  ColorFunction -> Function[{x, y, u}, Hue[u]]]}

enter image description here

POSTED BY: Jason Biggs

Perhaps you can give an example. To know if your plot is 2D or 3D, and is your parametric plot is over 1 or 2 variables?

POSTED BY: Sander Huisman
Reply to this discussion
Community posts can be styled and formatted using the Markdown syntax.
Reply Preview
Attachments
Remove
or Discard