Message Boards Message Boards

Supreme Court Ideological Data

Posted 8 years ago

enter image description here

I was intrigued by this New York Times article and its accompanying visualizations, and wanted to find out if I could get the raw data and work with it in the Wolfram Language. I found a description of the Martin-Quinn scores used in the article here, with raw data available here. Quoting short discription:

The "Martin-Quinn" scores are estimated for every justice serving from the October 1937 term to the present. Currently estimates are available through the October 2014 term.

-

enter image description here

-

The measures are estimated using a dynamic item response theory model, allowing judicial ideology to trend smoothly through time. The animated figure above demonstrates these dynamics. Since the scores are estimated from a probability model, they can be used to form other quantities of interest, such as locating the pivotal "median" justice, as all well the location of each case in the policy space.

From there, it was trivial to get the data:

scotusRaw = Import["http://mqscores.berkeley.edu/media/2014/justices.csv"];

In[131]:= scotusRaw[[;; 3]]
Out[131]= {{"term", "justice", "justiceName", "code", "post_mn", 
  "post_sd", "post_med", "post_025", "post_975"}, {2005, 112, "Alito",
   "ALTO", 1.523, 0.369, 1.516, 0.818, 2.248}, {2006, 112, "Alito", 
  "ALTO", 1.536, 0.31, 1.524, 0.961, 2.172}}

And then to do some minor cleanup to produce a nice Dataset:

In[158]:= heads = scotusRaw[[1]]
Out[158]= {"term", "justice", "justiceName", "code", "post_mn", \
"post_sd", "post_med", "post_025", "post_975"}

In[134]:= scotusDate = 
 MapAt[DateObject[{#}] &, #, 1] & /@ scotusRaw[[2 ;;]]

enter image description here

scotusDS = Dataset[AssociationThread[heads -> #] & /@ scotusDate]

enter image description here

From there, I could easily roll up a TimeSeries object for each justice:

scotusTS = 
 TimeSeries /@ 
  Values /@ 
   GroupBy[scotusDS, "justiceName"][[All, All, {"term", "post_mn"}]]

enter image description here

And plot changes in Martin-Quinn scores over time for each justice:

DateListPlot[scotusTS]

enter image description here

Or just for the current court (plus Scalia):

DateListPlot[
 scotusTS[{"Thomas", "Scalia", "Roberts", "Kennedy", "Ginsburg", 
   "Sotomayor", "Breyer", "Alito", "Kagan"}]]

enter image description here

And also get a different view of the distribution of scores by year:

scotusTerm = 
 GroupBy[scotusDS, "term"][All, All, "post_mn"] // KeySort
chart = BoxWhiskerChart[scotusTerm, "Outliers", 
  PlotTheme -> "Business"]

enter image description here

I'll refrain from making any political observations here, but it's an interesting dataset to explore. Feel free to grab my cleaned-up Dataset if you want to do some analysis and visualization of your own.

CloudObject["https://www.wolframcloud.com/objects/user-8a7d28b9-c01d-46b8-ba65-c3daa0ded865/SCOTUS-Martin-Quinn-Scores"]
POSTED BY: Alan Joyce
4 Replies

Alan, thank you for thinking of doing this analysis and sharing it with all of us. As someone new to the Wolfram Language, I learned quite a bit about it by decoding each line of your code. Wolfram Language seems perfectly well suited to ad hoc data exploration analyses like yours, among many other things.

POSTED BY: Greg Coladonato

A great article Alan. Full of interesting details. Is it possible to get a copy of the notebook from which you generated this article? Also in what ways do you think your analysis differs significantly from that of the NYT article?

Michael

POSTED BY: Michael Kelly

Here's another fun addition to the dataset created above. Let's start by building an association that maps values in the "justiceName" field to the correct Wolfram Language entities (given the number of justices with the same last names, this took a little manual curation):

scotusEntities = <|"Alito" -> Entity["Person", "SamuelAlito::4xxq6"], 
   "Black" -> Entity["Person", "HugoBlack::z7qyz"], 
   "Blackmun" -> Entity["Person", "HarryBlackmun::683p7"], 
   "Brandeis" -> Entity["Person", "LouisDBrandeis::rp384"], 
   "Brennan" -> Entity["Person", "WilliamJBrennan::3pk8c"], 
   "Breyer" -> Entity["Person", "StephenBreyer::7548r"], 
   "Burger" -> Entity["Person", "WarrenBurger::4ypbn"], 
   "Burton" -> Entity["Person", "HaroldHBurton::ngz7b"], 
   "Butler" -> Entity["Person", "PierceButler::q5z5n"], 
   "Byrnes" -> Entity["Person", "JamesFByrnes::9gg52"], 
   "Cardozo" -> Entity["Person", "BenjaminCardozo::zt976"], 
   "Clark" -> Entity["Person", "TomCClark::p44y5"], 
   "Douglas" -> Entity["Person", "WilliamODouglas::68ngy"], 
   "Fortas" -> Entity["Person", "AbeFortas::3747w"], 
   "Frankfurter" -> Entity["Person", "FelixFrankfurter::2986t"], 
   "Ginsburg" -> Entity["Person", "RuthBaderGinsburg::k4299"], 
   "Goldberg" -> Entity["Person", "ArthurJGoldberg::858bg"], 
   "Harlan" -> Entity["Person", "JohnMarshallHarlanII::5z64c"], 
   "Hughes" -> Entity["Person", "CharlesEvansHughes::c6ybr"], 
   "Jackson" -> Entity["Person", "RobertHJackson::757jm"], 
   "Kagan" -> Entity["Person", "ElenaKagan::9ynw2"], 
   "Kennedy" -> Entity["Person", "AnthonyKennedy::g8n56"], 
   "Marshall" -> Entity["Person", "ThurgoodMarshall::jh347"], 
   "McReynolds" -> Entity["Person", "JamesClarkMcReynolds::jgzj6"], 
   "Minton" -> Entity["Person", "ShayMinton::wm2r8"], 
   "Murphy" -> Entity["Person", "FrankMurphy::3bj27"], 
   "O'Connor" -> Entity["Person", "SandraDayOConnor::6q4n6"], 
   "OJRoberts" -> Entity["Person", "OwenRoberts::qts3c"], 
   "Powell" -> Entity["Person", "LewisFPowellJr::862m7"], 
   "Reed" -> Entity["Person", "StanleyReed::p9h95"], 
   "Rehnquist" -> Entity["Person", "WilliamRehnquist::5xqqp"], 
   "Roberts" -> Entity["Person", "JohnGRobertsJr::bw98f"], 
   "Rutledge" -> Entity["Person", "WileyBlountRutledge::342p7"], 
   "Souter" -> Entity["Person", "DavidSouter::9493r"], 
   "Stevens" -> Entity["Person", "JohnPaulStevens::jsm6r"], 
   "Stewart" -> Entity["Person", "PotterStewart::5zxkt"], 
   "Stone" -> Entity["Person", "HarlanFiskeStone::8kgyq"], 
   "Sutherland" -> Entity["Person", "GeorgeSutherland::72z7n"], 
   "Vinson" -> Entity["Person", "FredVinson::53s47"], 
   "Warren" -> Entity["Person", "EarlWarren::c5364"], 
   "White" -> Entity["Person", "ByronWhite::fp8gn"], 
   "Whittaker" -> Entity["Person", "CharlesEWhittaker::95m6j"], 
   "Sotomayor" -> Entity["Person", "SoniaSotomayor::6q2q7"], 
   "Scalia" -> Entity["Person", "AntoninScalia::39pg2"], 
   "Thomas" -> Entity["Person", "ClarenceThomas::5543z"]|>;

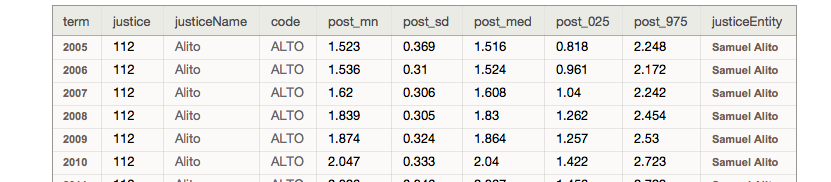
Then add Entities to the original dataset:

scotusData = 
 Append[#, <|"justiceEntity" -> scotusEntities[#justiceName]|>] & /@ 
  scotusDS

enter image description here

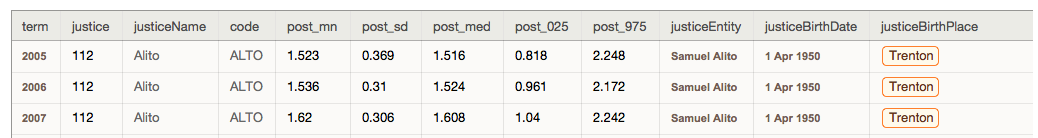
Then use EntityValue to make two more associations that map entities to their associated birth dates and birth places (this will be more efficient and less time consuming than making repeated EntityValue calls for each row in the dataset:

bdates = EntityValue[Values[scotusEntities], "BirthDate", 
   "EntityAssociation"];

bplace = EntityValue[Values[scotusEntities], "BirthPlace", 
   "EntityAssociation"];

scotusData = 
 Append[#, <|"justiceBirthDate" -> bdates[#justiceEntity], 
     "justiceBirthPlace" -> bplace[#justiceEntity]|>] & /@ scotusData

enter image description here

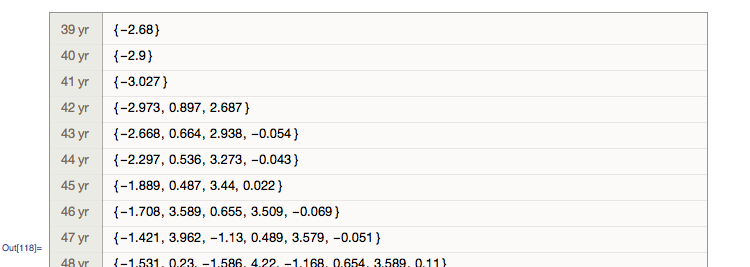
With those new fields in place, group scores by the approximate age of each justice for the term associated with each score:

scoresByAgeGrouped = 
 GroupBy[scotusData[
     All, {IntegerPart@
        DateDifference[#justiceBirthDate, #term, "Year"] &, 
      "post_mn"}], First][[All, All, 2]] // KeySort

enter image description here

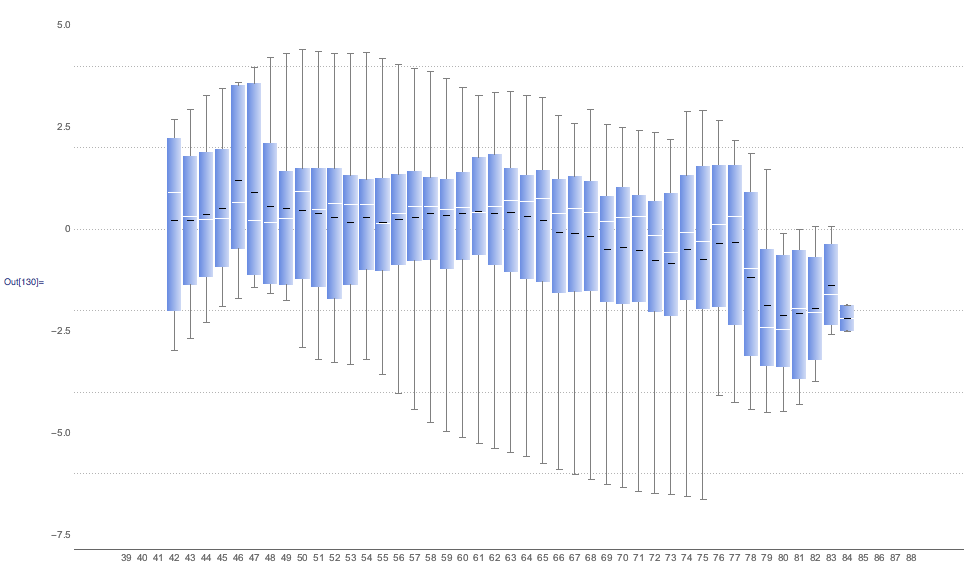
Then we can make a BoxWhiskerChart that shows the distribution of scores by age for justices covered by this dataset. (Interestingly, the mean score by age generally hovers a little above zero — or just slightly right-of-center — until the mid-60s, when mean scores start drifting to the left.)

In[121]:= ages = Normal[QuantityMagnitude /@ (Keys@scoresByAgeGrouped)]
Out[121]= {39, 40, 41, 42, 43, 44, 45, 46, 47, 48, 49, 50, 51, 52, \
53, 54, 55, 56, 57, 58, 59, 60, 61, 62, 63, 64, 65, 66, 67, 68, 69, \
70, 71, 72, 73, 74, 75, 76, 77, 78, 79, 80, 81, 82, 83, 84, 85, 86, \
87, 88}

BoxWhiskerChart[scoresByAgeGrouped, "Mean", PlotTheme -> "Business", 
 ChartLabels -> ages]

enter image description here

POSTED BY: Alan Joyce

enter image description here - you earned "Featured Contributor" badge, congratulations !

Dear @Alan Joyce, this is a great post and it has been selected for the curated Staff Picks group. Your profile is now distinguished by a "Featured Contributor" badge and displayed on the "Featured Contributor" board.

POSTED BY: Moderation Team
Reply to this discussion
Community posts can be styled and formatted using the Markdown syntax.
Reply Preview
Attachments
Remove
or Discard

Group Abstract Group Abstract