Here's another fun addition to the dataset created above. Let's start by building an association that maps values in the "justiceName" field to the correct Wolfram Language entities (given the number of justices with the same last names, this took a little manual curation):
scotusEntities = <|"Alito" -> Entity["Person", "SamuelAlito::4xxq6"],
   "Black" -> Entity["Person", "HugoBlack::z7qyz"],
   "Blackmun" -> Entity["Person", "HarryBlackmun::683p7"],
   "Brandeis" -> Entity["Person", "LouisDBrandeis::rp384"],
   "Brennan" -> Entity["Person", "WilliamJBrennan::3pk8c"],
   "Breyer" -> Entity["Person", "StephenBreyer::7548r"],
   "Burger" -> Entity["Person", "WarrenBurger::4ypbn"],
   "Burton" -> Entity["Person", "HaroldHBurton::ngz7b"],
   "Butler" -> Entity["Person", "PierceButler::q5z5n"],
   "Byrnes" -> Entity["Person", "JamesFByrnes::9gg52"],
   "Cardozo" -> Entity["Person", "BenjaminCardozo::zt976"],
   "Clark" -> Entity["Person", "TomCClark::p44y5"],
   "Douglas" -> Entity["Person", "WilliamODouglas::68ngy"],
   "Fortas" -> Entity["Person", "AbeFortas::3747w"],
   "Frankfurter" -> Entity["Person", "FelixFrankfurter::2986t"],
   "Ginsburg" -> Entity["Person", "RuthBaderGinsburg::k4299"],
   "Goldberg" -> Entity["Person", "ArthurJGoldberg::858bg"],
   "Harlan" -> Entity["Person", "JohnMarshallHarlanII::5z64c"],
   "Hughes" -> Entity["Person", "CharlesEvansHughes::c6ybr"],
   "Jackson" -> Entity["Person", "RobertHJackson::757jm"],
   "Kagan" -> Entity["Person", "ElenaKagan::9ynw2"],
   "Kennedy" -> Entity["Person", "AnthonyKennedy::g8n56"],
   "Marshall" -> Entity["Person", "ThurgoodMarshall::jh347"],
   "McReynolds" -> Entity["Person", "JamesClarkMcReynolds::jgzj6"],
   "Minton" -> Entity["Person", "ShayMinton::wm2r8"],
   "Murphy" -> Entity["Person", "FrankMurphy::3bj27"],
   "O'Connor" -> Entity["Person", "SandraDayOConnor::6q4n6"],
   "OJRoberts" -> Entity["Person", "OwenRoberts::qts3c"],
   "Powell" -> Entity["Person", "LewisFPowellJr::862m7"],
   "Reed" -> Entity["Person", "StanleyReed::p9h95"],
   "Rehnquist" -> Entity["Person", "WilliamRehnquist::5xqqp"],
   "Roberts" -> Entity["Person", "JohnGRobertsJr::bw98f"],
   "Rutledge" -> Entity["Person", "WileyBlountRutledge::342p7"],
   "Souter" -> Entity["Person", "DavidSouter::9493r"],
   "Stevens" -> Entity["Person", "JohnPaulStevens::jsm6r"],
   "Stewart" -> Entity["Person", "PotterStewart::5zxkt"],
   "Stone" -> Entity["Person", "HarlanFiskeStone::8kgyq"],
   "Sutherland" -> Entity["Person", "GeorgeSutherland::72z7n"],
   "Vinson" -> Entity["Person", "FredVinson::53s47"],
   "Warren" -> Entity["Person", "EarlWarren::c5364"],
   "White" -> Entity["Person", "ByronWhite::fp8gn"],
   "Whittaker" -> Entity["Person", "CharlesEWhittaker::95m6j"],
   "Sotomayor" -> Entity["Person", "SoniaSotomayor::6q2q7"],
   "Scalia" -> Entity["Person", "AntoninScalia::39pg2"],
   "Thomas" -> Entity["Person", "ClarenceThomas::5543z"]|>;
Then add Entities to the original dataset:
scotusData =
 Append[#, <|"justiceEntity" -> scotusEntities[#justiceName]|>] & /@
  scotusDS

Then use EntityValue to make two more associations that map entities to their associated birth dates and birth places (this will be more efficient and less time consuming than making repeated EntityValue calls for each row in the dataset:
bdates = EntityValue[Values[scotusEntities], "BirthDate",
   "EntityAssociation"];

bplace = EntityValue[Values[scotusEntities], "BirthPlace",
   "EntityAssociation"];

scotusData =
 Append[#, <|"justiceBirthDate" -> bdates[#justiceEntity],
     "justiceBirthPlace" -> bplace[#justiceEntity]|>] & /@ scotusData

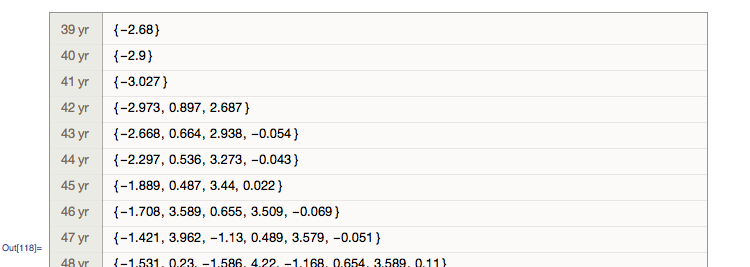
With those new fields in place, group scores by the approximate age of each justice for the term associated with each score:
scoresByAgeGrouped =
 GroupBy[scotusData[
     All, {IntegerPart@
        DateDifference[#justiceBirthDate, #term, "Year"] &,
      "post_mn"}], First][[All, All, 2]] // KeySort

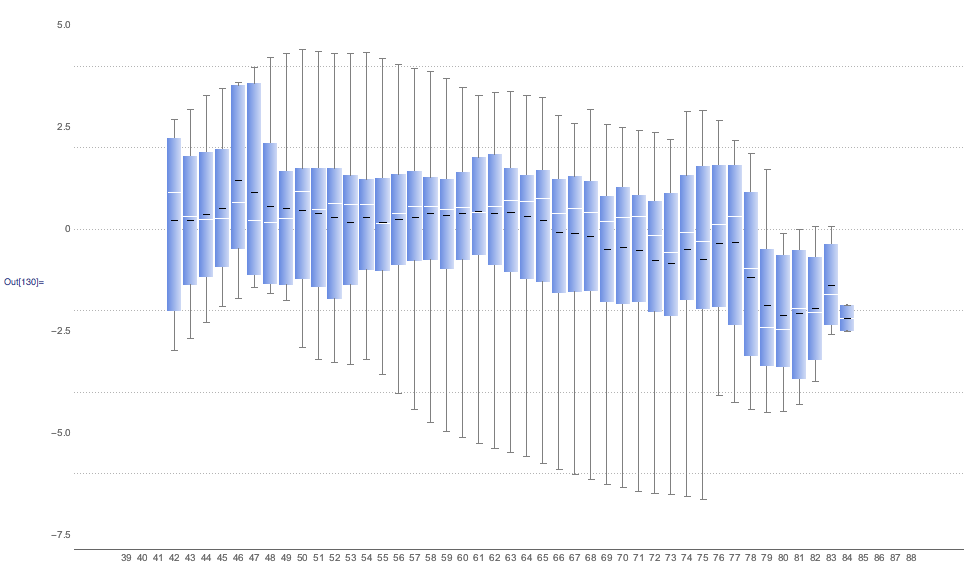
Then we can make a BoxWhiskerChart that shows the distribution of scores by age for justices covered by this dataset. (Interestingly, the mean score by age generally hovers a little above zero or just slightly right-of-center until the mid-60s, when mean scores start drifting to the left.)
In[121]:= ages = Normal[QuantityMagnitude /@ (Keys@scoresByAgeGrouped)]
Out[121]= {39, 40, 41, 42, 43, 44, 45, 46, 47, 48, 49, 50, 51, 52, \
53, 54, 55, 56, 57, 58, 59, 60, 61, 62, 63, 64, 65, 66, 67, 68, 69, \
70, 71, 72, 73, 74, 75, 76, 77, 78, 79, 80, 81, 82, 83, 84, 85, 86, \
87, 88}

BoxWhiskerChart[scoresByAgeGrouped, "Mean", PlotTheme -> "Business",
 ChartLabels -> ages]
