Message Boards Message Boards

[GIF] Reveal (The torus in relief)

The torus in relief

Reveal

A rather different way of producing cross sections. Here a bunch of parallel lines starting at $z=1$ and $z=-1$ move towards the $xy$-plane, getting hung up on a torus of revolution as they go. The end result is a bunch of cross sections of the torus, now realized as a sort of relief.

Here's the (super-slow) code, which could undoubtedly be streamlined:

?[s_] := 2 + Cos[s]; ?[s_] := Sin[s];

DynamicModule[{torus, cols, r, s},
 torus[x_, 
   y_] := {?[v] Cos[u], ?[v] Sin[u], ?[v]} /. {u -> 
     ArcTan[x, y], v -> ArcCos[Sqrt[x^2 + y^2] - 2]};
 cols = RGBColor /@ {"#5FC9F3", "#081F37"};
 r = 2.7;
 Manipulate[
  s = 1/2 + 1/2 Cos[?]; 
  ParametricPlot3D[
   Table[{x, y, 
     If[1 < x^2 + y^2 < 9, i Max[s, torus[x, y][[3]]], i s]}, {i, {-1,
       1}}, {x, -4.5, 4.5, 1/4}], {y, -4, 4}, 
   PlotStyle -> Directive[Thickness[.003], cols[[1]]], 
   PlotRange -> {{-4.5, 4.5}, {-4.5, 4.5}, {-1.5, 1.5}}, 
   PlotPoints -> 200, Boxed -> False, Axes -> None, 
   ViewPoint -> 100 {1, 0, r}, 
   ViewAngle -> ?/(4*100*Sqrt[1 + r^2]), ImageSize -> 540, 
   Background -> cols[[2]]], {?, 0, ?}]]
4 Replies

Clayton, this is a cool animation, I really like the approach.

But the code with the Dynamic and Manipulate ran so slow that I couldn't even see an animation.

When I try to make a plot for just a single value of theta, it takes about 10 seconds on my machine. I was able to get this to about half a second by simplifying the plotted function and compiling it. It was still too slow for Manipulate in my opinion, so I made a list of images before plotting

funcsc = Compile[{{th, _Real}, {y, _Real}},
   Evaluate@Table[
     With[{x = x, i = i, s = 1/2 + 1/2 Cos[th]},
      {x, y,  
       If[1 < x^2 + y^2 < 9, 
        i Max[s, Sin[ArcCos[Sqrt[x^2 + y^2] - 2]]], i s]}], {i, -1, 
      1}, {x, -4.5, 4.5, 1/4}]
   ];
cols = RGBColor /@ {"#5FC9F3", "#081F37"};
r = 2.7; 
imglist = Table[ParametricPlot3D[funcsc[?, y]
        , {y, -4, 4}, 
        PlotStyle -> Directive[Thickness[.003], cols[[1]]], 
        PlotRange -> {{-4.5, 4.5}, {-4.5, 4.5}, {-1.5, 1.5}}, 
        PlotPoints -> 100, Boxed -> False, Axes -> None, 
        ViewPoint -> 100 {1, 0, r}, 
        ViewAngle -> ?/(4*100*Sqrt[1 + r^2]), ImageSize -> 540, 
        Background -> cols[[2]]], {?, 0, 
     2 ?, .1}];~Monitor~?
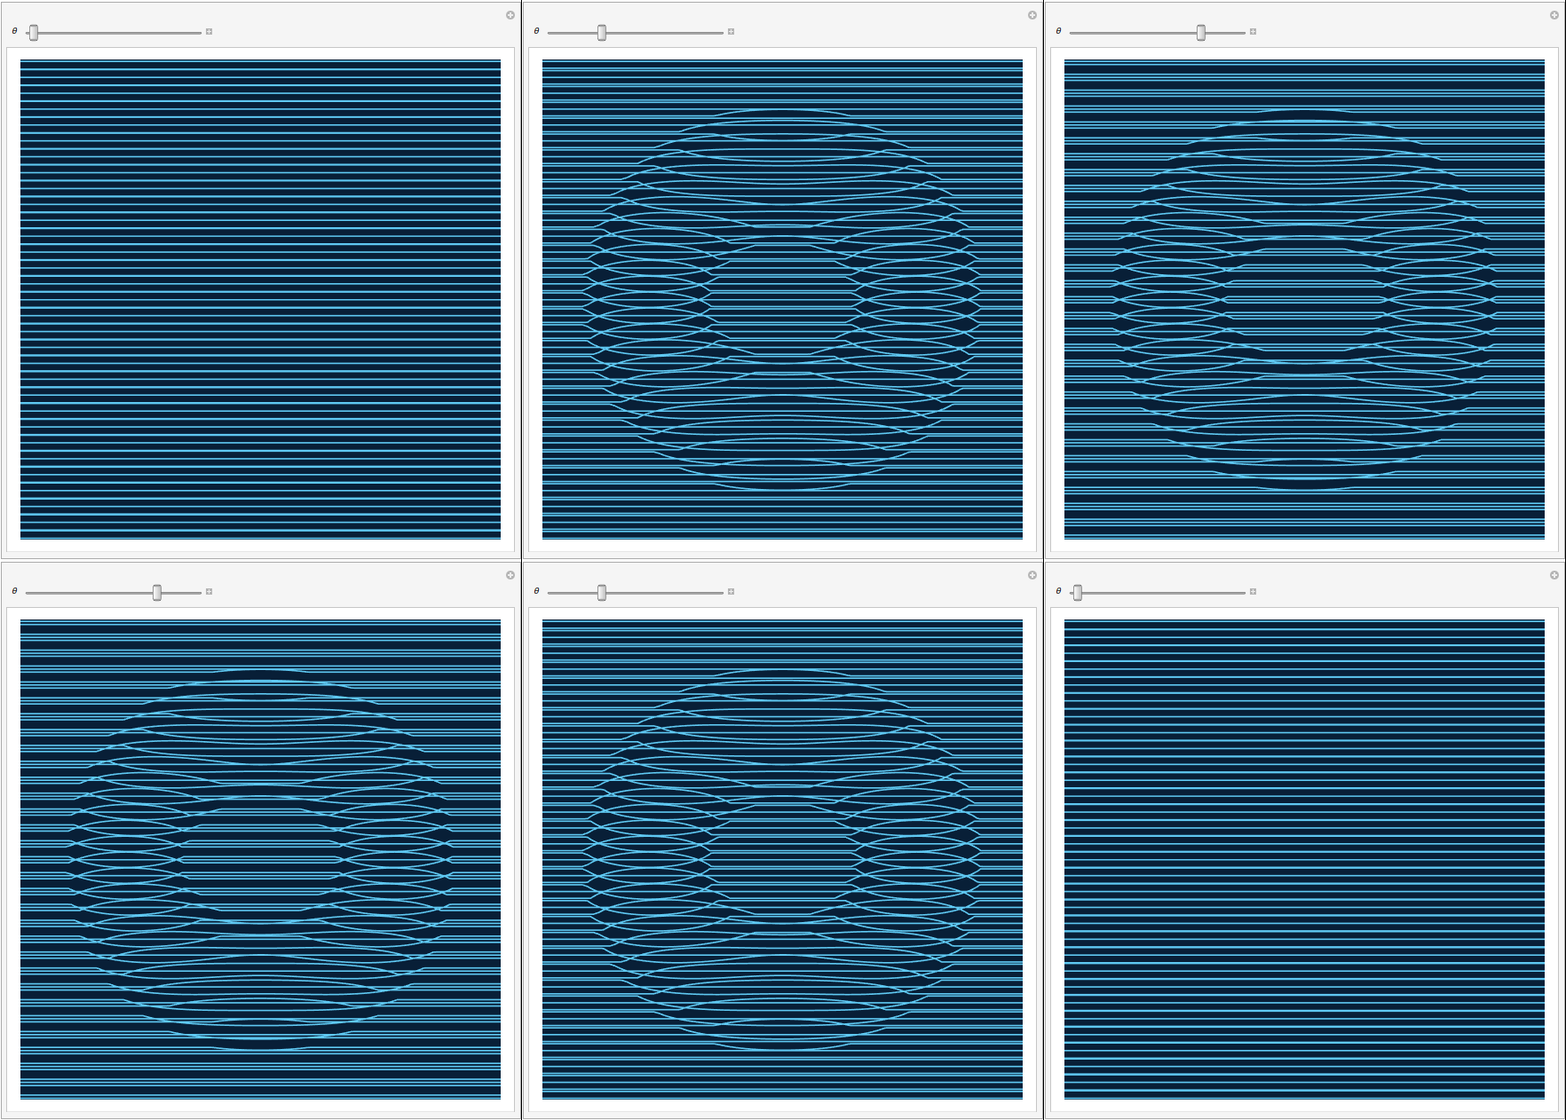
enter image description here

POSTED BY: Jason Biggs

@Jason Biggs Ah, yes, compiling the function is smart. One quibble with your definition: you have an extraneous $i=0$ row in the table that just produces straight lines sitting at $z=0$. So I would define funcsc like this:

funcsc = Compile[{{th, _Real}, {y, _Real}}, 
   Evaluate@
    Table[With[{x = x, i = i, s = 1/2 + 1/2 Cos[th]}, {x, y, 
       If[1 < x^2 + y^2 < 9, 
        i Max[s, Sin[ArcCos[Sqrt[x^2 + y^2] - 2]]], i s]}], {i, {-1, 
       1}}, {x, -4.5, 4.5, 1/4}]];

But otherwise, your code is definitely faster, which would have come in handy when I was rendering the GIF last night.

enter image description here - another post of yours has been selected for the Staff Picks group, congratulations !

We are happy to see you at the tops of the "Featured Contributor" board. Thank you for your wonderful contributions, and please keep them coming!

POSTED BY: EDITORIAL BOARD

@Moderation Team Cool, thanks!

Reply to this discussion
Community posts can be styled and formatted using the Markdown syntax.
Reply Preview
Attachments
Remove
or Discard

Group Abstract Group Abstract