I was wondering the same thing, with some trace magic I found a symbolic version of the graph (I only needed it once, so this was OK for me):
out=Quiet[Cases[Dendrogram[{1,2,5,3.3}]//Trace,Association[___],\[Infinity]]];
out=Quiet[Select[out,KeyExistsQ[#,"Edges"]\[And]KeyExistsQ[#,"NamesAssociation"]&]];
out=Last[out]
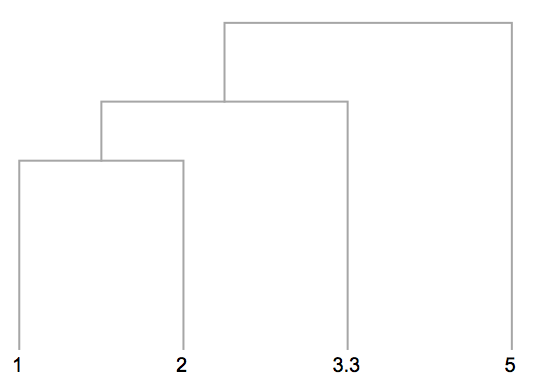
Dendrogram[{1,2,5,3.3}]
out:
<|"Edges" -> {1 -> 2, 2 -> 3, 3 -> 4, 3 -> 5, 2 -> 6, 1 -> 7},
 "NamesAssociation" -> <|1 -> {{{1, 2}, 3.3}, 5}, 2 -> {{1, 2}, 3.3},
   3 -> {1, 2}, 4 -> 1, 5 -> 2, 6 -> 3.3, 7 -> 5|>|>
Perhaps if you dig a little in the Trace you can find the actual command...


