Message Boards Message Boards

Visualize simulation using NDSolve for Beddington-DeAngelis model?

Posted 9 years ago

Hello

I was wondering if I have done something wrong when trying to simulate the Beddington-DeAngelis model using the NDSolve. The code is as follows:

eqnsDiff[\[Alpha]_, \[Beta]_, \[Epsilon]_, \[Delta]_, \[Mu]_, x0_, 
y0_] := {x'[t] == 
x[t] (1 - x[t]) - (\[Alpha] x[t] y[t])/(
1 + \[Beta] x[t] + \[Mu] y[t]), 
y'[t] == \[Epsilon] (x[t] y[t])/(
1 + \[Beta] x[t] + \[Mu] y[t]) - \[Delta] y[t], x[0] == x0, 
y[0] == y0}

tf = 500;
tsamp = 2;
npoints = Ceiling[(tf/tsamp) + 1];
s1 = NDSolve[
   eqnsDiff[1, 13/10, 4, 4/10, 1/10000, 15/100, 5/10], {x, y}, {t, 0, 
    tf}];
Plot[Evaluate[{x[t], y[t]} /. s1], {t, 0, tf}, ImageSize -> Large]

enter image description here

There is a small glitch near t=200. I don't think that is part of the solution.

Many thanks.

Ed

POSTED BY: Eduardo Mendes
2 Replies
Posted 9 years ago

Hi Marco

Many thanks. Would you know why only at t=200 Plot misses the points?

Cheers

Ed

POSTED BY: Eduardo Mendes

Hi Ed,

if you use "Mesh-> All" you see that this is a plotting issue:

eqnsDiff[\[Alpha]_, \[Beta]_, \[Epsilon]_, \[Delta]_, \[Mu]_, x0_, 
  y0_] := {x'[t] == 
   x[t] (1 - 
       x[t]) - (\[Alpha] x[t] y[t])/(1 + \[Beta] x[t] + \[Mu] y[t]), 
  y'[t] == \[Epsilon] (x[t] y[
         t])/(1 + \[Beta] x[t] + \[Mu] y[t]) - \[Delta] y[t], 
  x[0] == x0, y[0] == y0}

tf = 500;
tsamp = 2;
npoints = Ceiling[(tf/tsamp) + 1];
s1 = NDSolve[
   eqnsDiff[1, 13/10, 4, 4/10, 1/10000, 15/100, 5/10], {x, y}, {t, 0, 
    tf}];
Plot[Evaluate[{x[t], y[t]} /. s1], {t, 0, tf}, ImageSize -> Large, 
 Mesh -> All]

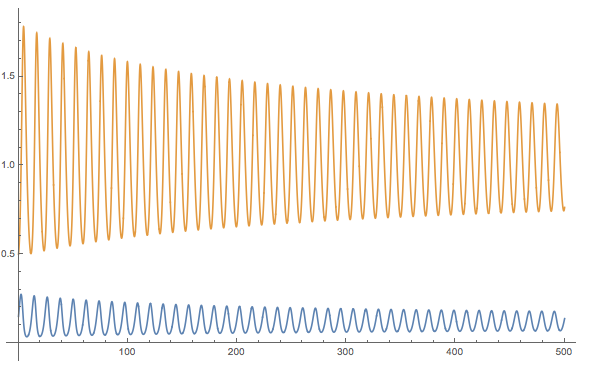
This is a bit unexpected but only shows that you just need to plot some more points:

eqnsDiff[\[Alpha]_, \[Beta]_, \[Epsilon]_, \[Delta]_, \[Mu]_, x0_, 
  y0_] := {x'[t] == 
   x[t] (1 - 
       x[t]) - (\[Alpha] x[t] y[t])/(1 + \[Beta] x[t] + \[Mu] y[t]), 
  y'[t] == \[Epsilon] (x[t] y[
         t])/(1 + \[Beta] x[t] + \[Mu] y[t]) - \[Delta] y[t], 
  x[0] == x0, y[0] == y0}

tf = 500;
tsamp = 2;
npoints = Ceiling[(tf/tsamp) + 1];
s1 = NDSolve[
   eqnsDiff[1, 13/10, 4, 4/10, 1/10000, 15/100, 5/10], {x, y}, {t, 0, 
    tf}];
Plot[Evaluate[{x[t], y[t]} /. s1], {t, 0, tf}, ImageSize -> Large, 
 PlotPoints -> 100]

enter image description here

Cheers,

Marco

POSTED BY: Marco Thiel
Reply to this discussion
Community posts can be styled and formatted using the Markdown syntax.
Reply Preview
Attachments
Remove
or Discard

Group Abstract Group Abstract