Message Boards Message Boards

How to manipulate the order of outputs to Solve?

Posted 8 years ago

I am trying to find the roots of a polynomial of eight degree $$\sin^8\varphi-2\lambda_i^2\sin^6\varphi+(6\lambda_i^2+\lambda_i^4)\sin^4\varphi-(4\lambda_i^2+2\lambda_i^4)\sin^2\varphi+\lambda_i^4=0$$ where $$\lambda _i=\frac{mg-F\frac i n}{2kl}.$$

I have to find the solutions to that eight degree polynomial for each $\lambda_i$ where $i=1...n$, which I did with the following code:

F = 1430;(*N*)
k = 1010;(*N/m*)
l = 0.4;(*m*)
m = 10;(*kg*)
g = 9.81;(*m/s^2*)
n = 100;

? = Table[(m g - F*(i/n))/(2 k l), {i, 0, n, 1}];
resitve = Table[
    Solve[
     x^8 - 2 ?[[i]]^2 x^6 + (6 ?[[i]]^2 + ?[[i]]^4) x^4 - (2 ?[[i]]^4 + 
     4 ?[[i]]^2) x^2 + ?[[i]]^4 == 0, x, Reals
    ], 
   {i, 1, Length[?], 1}
  ]

kotiMinusBig =   Table[ArcSin[resitve[[i, 1, 1, 2]]]*180/Pi, {i, 1, Length[?], 1}];
kotiMinusSmall = Table[ArcSin[resitve[[i, 2, 1, 2]]]*180/Pi, {i, 1, Length[?], 1}];
kotiPlusSmall =  Table[ArcSin[resitve[[i, 3, 1, 2]]]*180/Pi, {i, 1, Length[?], 1}];
kotiPlusBig =    Table[ArcSin[resitve[[i, 4, 1, 2]]]*180/Pi, {i, 1, Length[?], 1}];

tockeMinusBig =   Table[{(F/n)*(i - 1)/1000, kotiMinusBig[[i]]}, {i, 1, Length[?], 1}];
tockeMinusSmall = Table[{(F/n)*(i - 1)/1000, kotiMinusSmall[[i]]}, {i, 1, Length[?], 1}];
tockePlusSmall =  Table[{(F/n)*(i - 1)/1000, kotiPlusSmall[[i]]}, {i, 1, Length[?], 1}];
tockePlusBig =    Table[{(F/n)*(i - 1)/1000, kotiPlusBig[[i]]}, {i, 1, Length[?], 1}];

ListPlot[{tockeMinusBig, tockeMinusSmall, tockePlusBig, tockePlusSmall}]

This produces the following output: enter image description here

Now my question is: Does Mathematica somehow automatically order the solutions to Solve?

Or a question related to the example above: Starting at the left: Does the $y$ value of those green dots really start increasing for $x>0.1$, or do they actually continue to decrease continuously to the blue dots for $x>0.1$, but Mathematica ordered them weirdly and now it looks as if the green solutions starts increasing?

Which is the case, and how can I correct it?

NOTE: The problem explicitly says that the $F_i$ domain has to stay discrete.

POSTED BY: Mitja Jan?i?
5 Replies

It works for n=5000, you just need to be using a different starting point to undo the sorting:

First@Ordering[resitve[[All, 4]]]
344

resitveOrdered = MapAt[Reverse, resitve, List /@ Range[344, Length[\[Lambda]]]];

tocke All Ordered n5000

It is pretty clear, that Solve is sorting the four solutions from smallest to largest.

Find the position of the inflection then, undo the sorting from there:

Ordering[resitve[[All, 4]]]
{8, 7, 9, 6, 10, 5, 11, 4, 12, 3, 13, 2, 14, 1, 15, 16, 17, 18, 19, \
.. 88, 89, 90, 91, 92, 93, 94, 95, 96, 97, 98, 99, 100, 101}

Test the new ordering, see if it looks smooth:

MapAt[Reverse, resitve, List /@ Range[8, Length[\[Lambda]]]][[All,  4]] // Ordering
{101, 100, 99, 98, 97, 96, 95, 94, 93, 92, 91, 90, 89, 88, \
.. 19, 18, 17, 16, 15, 14, 13, 12, 11, 10, 9, 8, 7, 6, 5, 4, 3, 2, 1}

Apply the new ordering and rebuild the resulting processed solutions:

resitveOrdered = MapAt[Reverse, resitve, List /@ Range[8, Length[\[Lambda]]]];

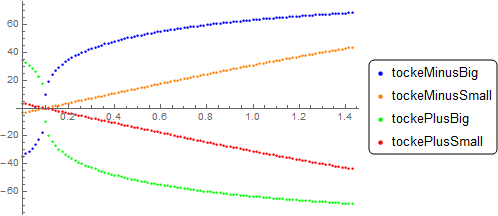
Results now look like this:

tocke All Ordered

That works! Thank you! But I wonder why it only works for small value of n? If n=5000, than this doesn't work anymore.

POSTED BY: Mitja Jan?i?

Identify the feature you are interested in isolating:

ListPlot[{
  tockeMinusBig,
  tockeMinusSmall,
  tockePlusBig,
  tockePlusSmall},
 PlotStyle -> {Blue, Orange, Green, Red},
 PlotLegends -> PointLegend[{Blue, Orange, Green, Red},
   {
    "tockeMinusBig",
    "tockeMinusSmall",
    "tockePlusBig",
    "tockePlusSmall"
    }, LegendFunction -> "Frame"]]

tochke All

Then display that data alone:

ListPlot[{
  tockePlusBig},
 PlotStyle -> {Green},
 PlotLegends -> PointLegend[{Green},
   {
    "tockePlusBig"
    }, LegendFunction -> "Frame"]]

tockePlusBig Alone

The data for tockePlusBig uses kotiPlusBig and resitve[[i, 4, 1, 2]]. Display the raw (y) values for restive that where used:

ListPlot[{
  resitve[[All, 4, 1, 2]]},
 PlotStyle -> {Green},
 PlotLegends -> PointLegend[{Green},
   {
    "resitve[[All,4,1,2]]"
    }, LegendFunction -> "Frame"]]

tockePlusBig resitve

Maybe I wasn't clear what the problem is.. I was able to find continuous solutions and this is how they look like

enter image description here

Now see the discrete values in my original post and you will see what the problem is there!

POSTED BY: Mitja Jan?i?
Reply to this discussion
Community posts can be styled and formatted using the Markdown syntax.
Reply Preview
Attachments
Remove
or Discard

Group Abstract Group Abstract